
Fig 1. Methylation signals and levels of background noise.
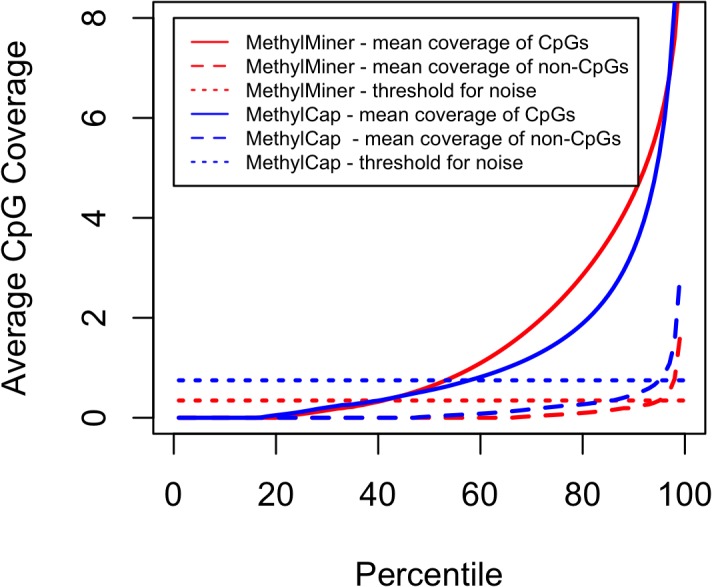
The mean coverage of CpGs and non-CpGs from MethylMiner and MethylCap, respectively are shown. The horizontal lines indicate the threshold for background noise as determined by the 95th percentile of the estimated coverage of the non-CpGs for MethylMiner and MethylCap, respectively.