
Fig 2. The overlap of MethylMiner and MethylCap with local CpG density.
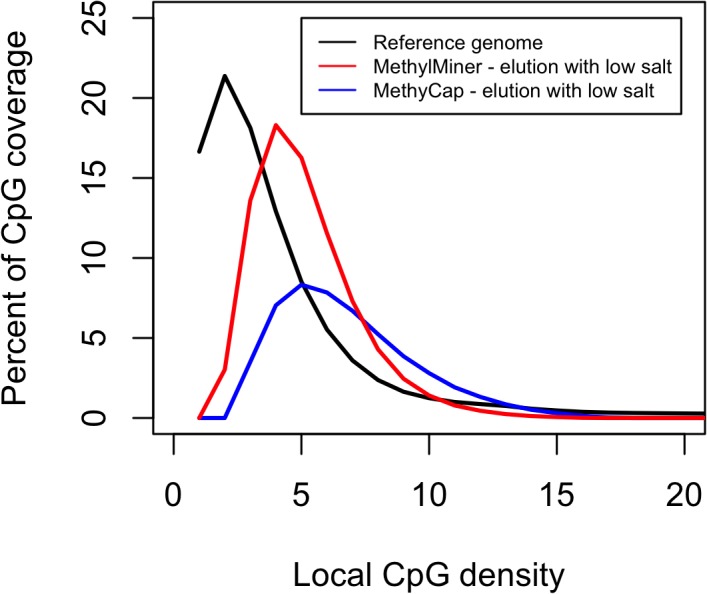
The local CpG density is plotted against the percentage CpG coverage. The distribution of the local CpG density in the reference sequence is the highest outside of CpG-rich regions. Better coverage of the regions where the majority of CpGs occur (in the range of 1–7 CpGs) is obtained with MethylMiner than with MethylCap.