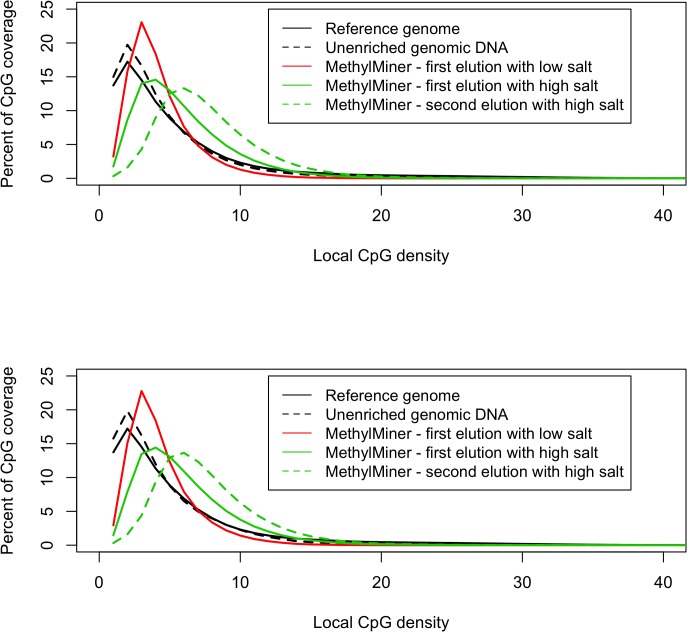
Fig 3. The effect of altered salt concentrations for elutions in MethylMiner.
The shown data was generated as part of our recent methylome-wide investigations in humans[5]. The local CpG density is plotted against the percentage CpG coverage for two randomly selected individuals in the upper and lower graph, respectively. As expected, the unenriched genomic DNA closely follows the distribution of the CpG density in the reference genome. Best coverage of the regions where the majority of CpGs occur (in the range of 1–7 CpGs) is obtained by a single MethylMiner elution using a low salt (0.5M NaCl) buffer. Using a single elution with a higher salt (2.0M NaCl) concentration moves the distribution to regions with higher CpG density. If performing a double elution where the low salt elution is discarded and only the 2nd fraction eluted with the high salt buffer is investigated, the distribution is shifted even further to the right excluding regions with low local CpG density and focusing mainly in regions with high CpG density.

