
Fig 4. The effect of altered salt concentrations for elutions in MethylCap.
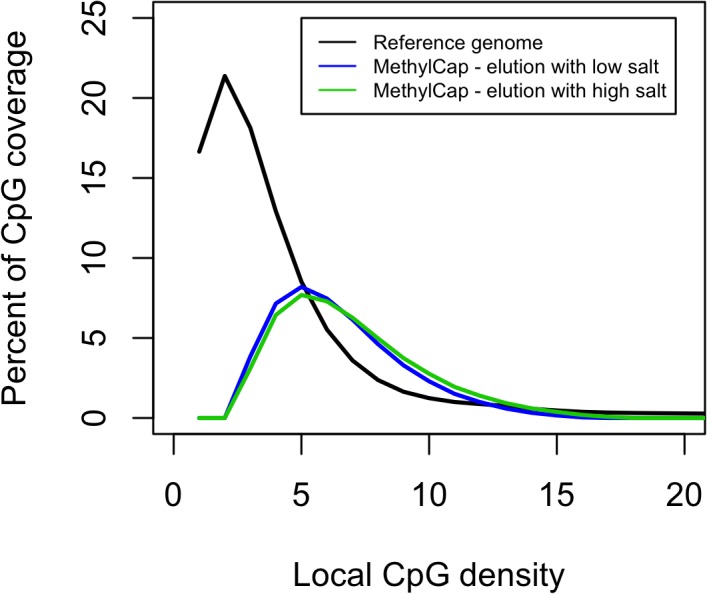
The local CpG density is plotted against and the percentage CpG coverage. The distribution of the local CpG density in the reference genome is shown. The distribution of CpG coverage for MethylCap is shown when using a low salt elution buffer and when using a high salt elution buffer.