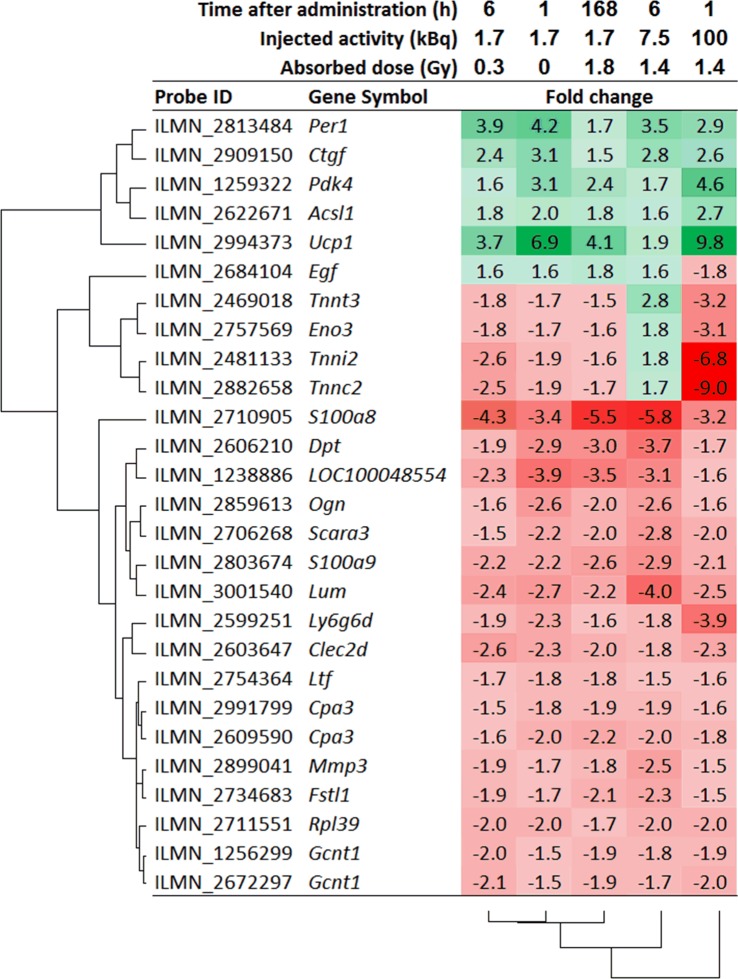
Fig 3. Recurrently regulated genes.
Genes regulated in all irradiated groups after 211At administration. Hierarchical clustering was performed using the hclust function with the complete linkage algorithm and Lance-Williams dissimilarity update formula in the R statistical computing environment (http://www.r-project.org) [27]. Red and green color indicate down- and upregulation, respectively.

