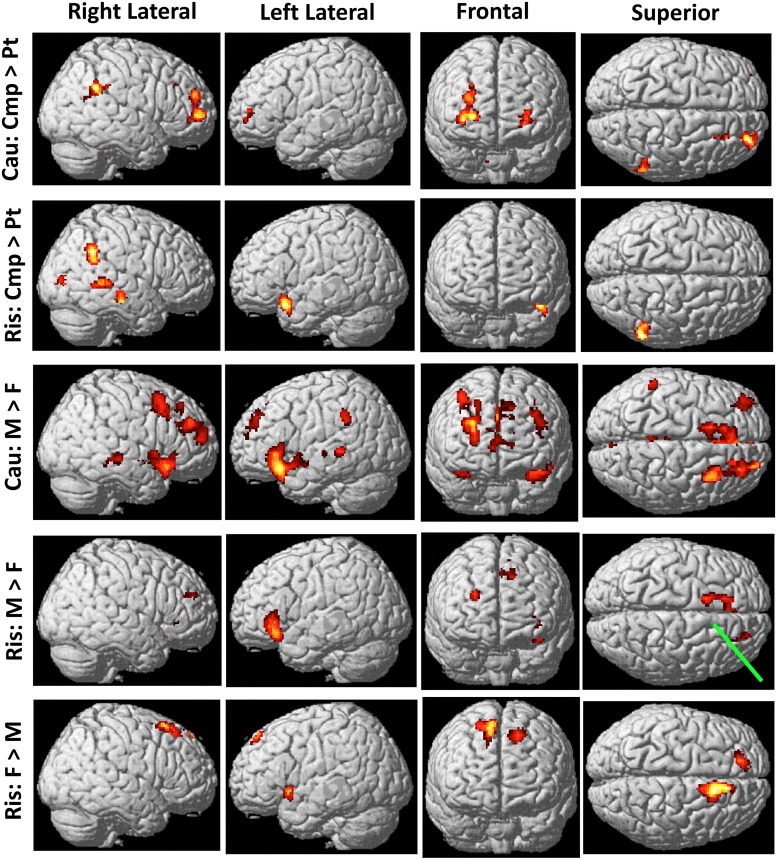
Fig 3. Cortical regions near scalp where groups' activations differed significantly.
These regions are potentially accessible to transcranial direct current stimulation. Row labels: Cau, before cautious responses. Ris, before risky responses. Cmp, comparison participants. F, females. M, males. Pt, patients. Three rows of possible activations not shown: (a) Cau: Pt>Cmp and (b) Ris: Pt>Cmp, were both devoid of activation; (c) Cau: F>M had activation only at site marked by Green pointer tip in Ris: M>F. Significant t-values range from 2.64 (dark red) to 7.76 (white); details in Tables 4 and 5.

