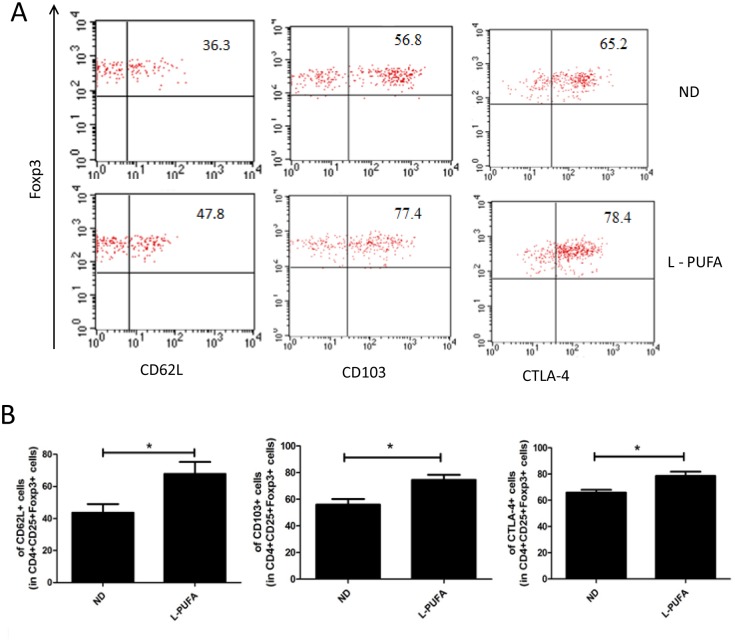
Fig 2. The phenotype of hepatic Tregs.
HMNCs were isolated from mice consuming normal diet (ND) or low concentration of n-3 PUFA-enriched diet (L-PUFA). The expression of CD62L, CD103 and CTLA-4 on hepatic Tregs (CD4+CD25+Foxp3+) was analyzed by flow cytometry. A) Representative dot plots of CD62L, CD103 and CTLA-4 expression on Tregs in the right upper quadrant. B) Mean (±SD) percentage of CD62L, CD103 and CTLA-4 expression among Tregs (n = 5 each group). *p<0.05

