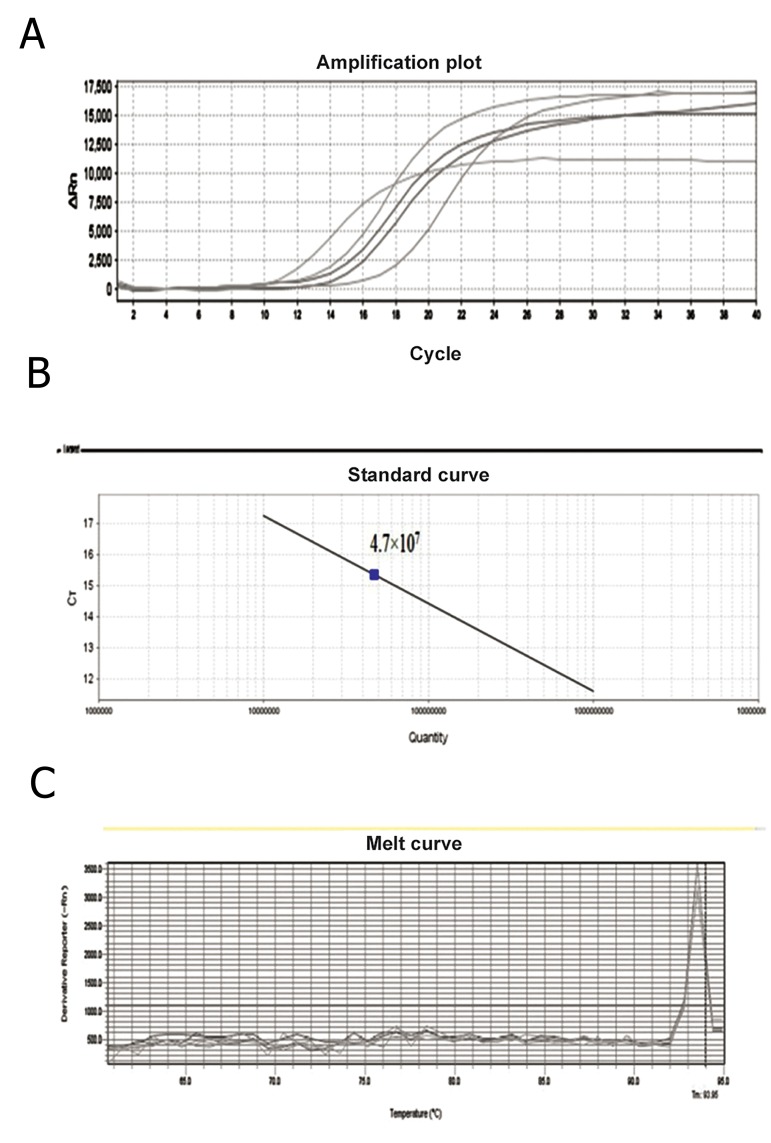
Fig.4.
Quantitation of lentivrus vector samples by real-time polymerase chain reaction. A. Amplification plot of samples with each dilution represented in order from left to right on the graph, B. Standard curve for quantification of viral samples. Three 10-fold-dilutions (7.23×10⁷-7.23×10⁹ copies of the plasmid/μl) were used. The viral titer was 4.7×10⁷ particles/μl and C. Melting curve analysis of the samples. The products from the vector and viral samples had the same melting point peak at 93.85˚C.

