Fig. 5.
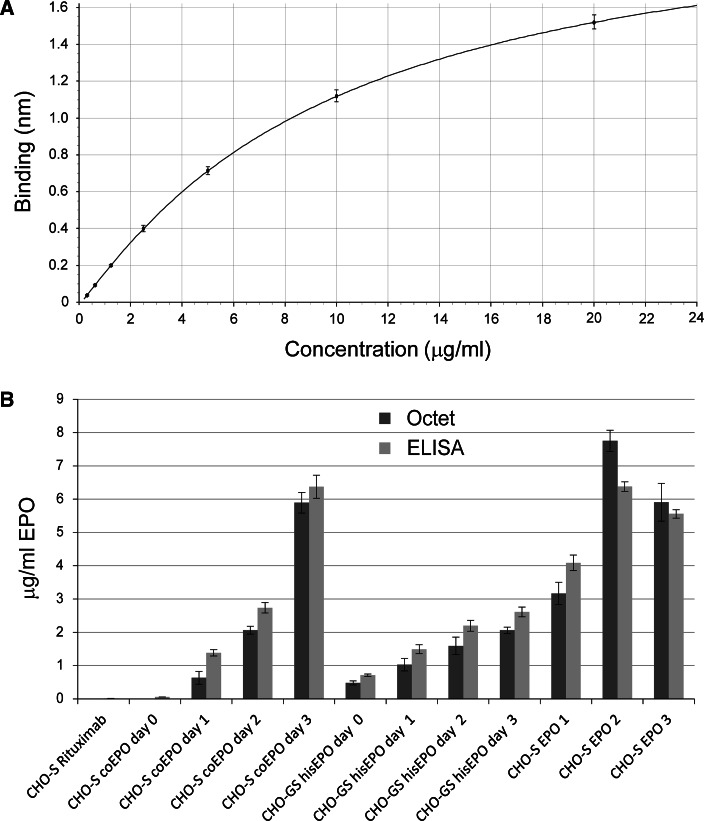
Comparison of Octet and ELISA absolute quantification. a Standard curve generated from dilution series of in-house purified EPO of known concentration using end-point values. Samples were run in triplicate. b Absolute EPO concentrations were determined of supernatants harvested from a stable cell line of CHO-S expressing the codon-optimized gene for EPO (coEPO), a stable cell line of CHO-GS expressing His-tagged EPO, and several transient transfected cell lines (3× CHO-S expressing EPO and CHO-S expressing Rituximab). Where indicated, supernatants were harvested on day 0, 1, 2, and 3. Empty vector supernatants were used as blank and samples were analyzed in triplicate in both assays

