
Fig. 2.
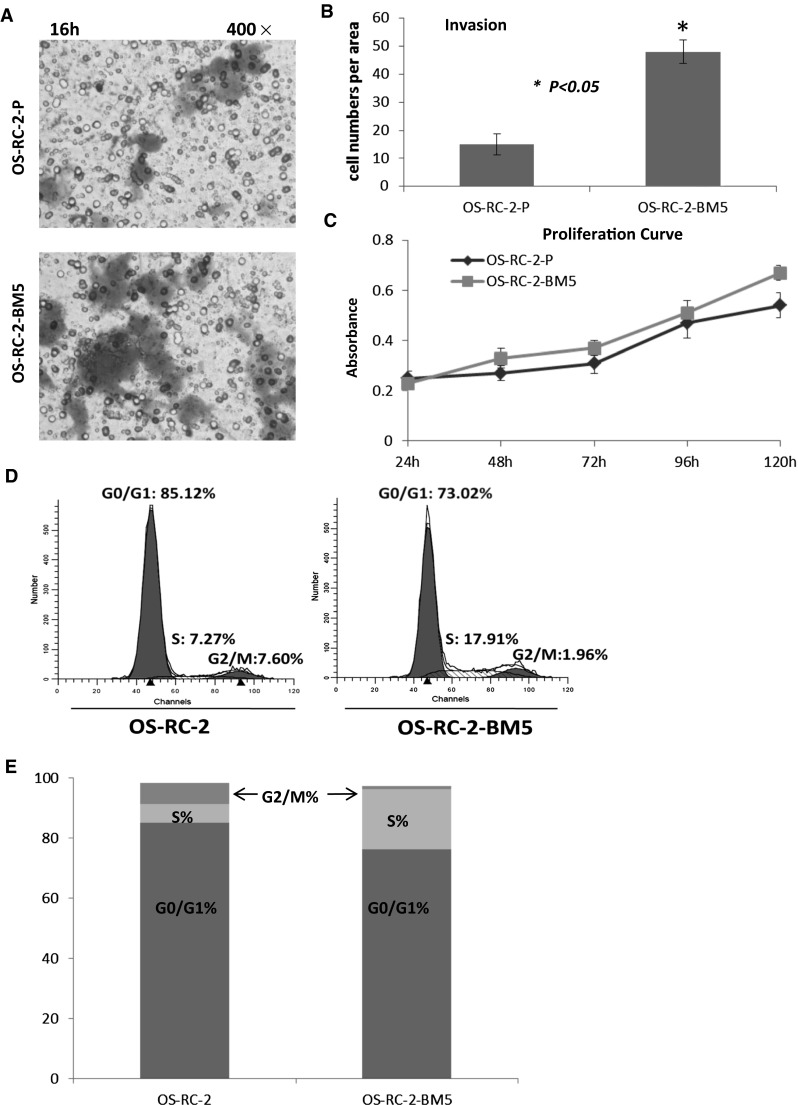
a The transwell migration assay to investigate the invasive ability of OS-RC-2-P and OS-RC-2-BM5 cells after 16 h incubation. b The number of transmembrane cells for OS-RC-2-P and OS-RC-2-BM5 cells showed as column chart. Asterisk means the transmembrane number of OS-RC-2-BM5 cells is pretty higher, comparing to OS-RC-2 cells, P < 0.05. c The proliferation curve which was got by MTT assay at time point 24, 48, 72, 96, 120 h respectively. d The flow cytometry analyzing cell cycle. e Comparison of cell cycles on two cell lines