Fig. 3.
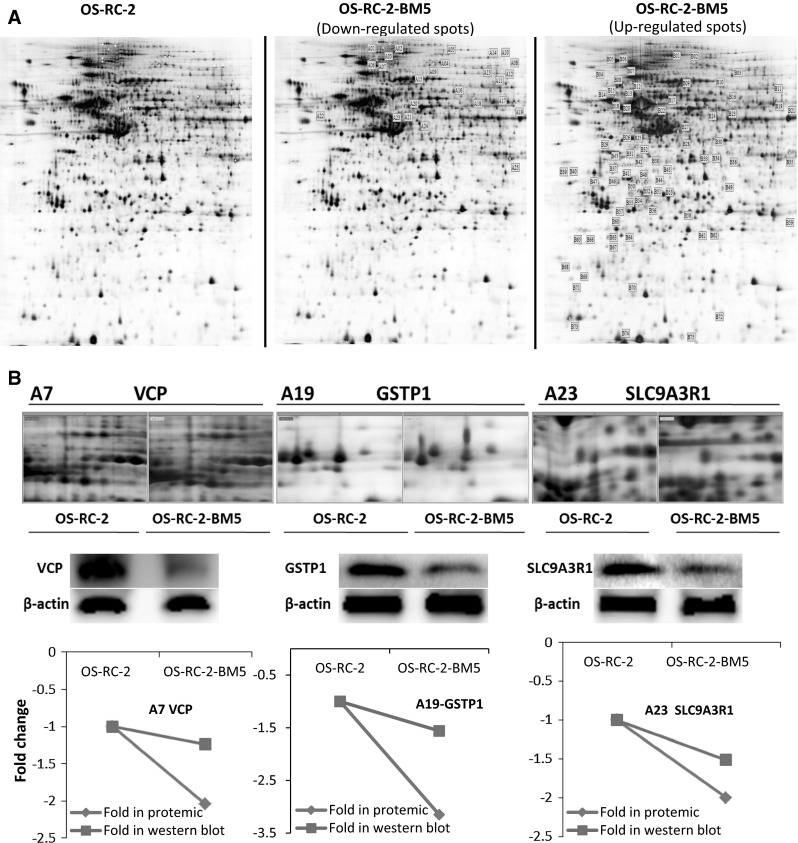
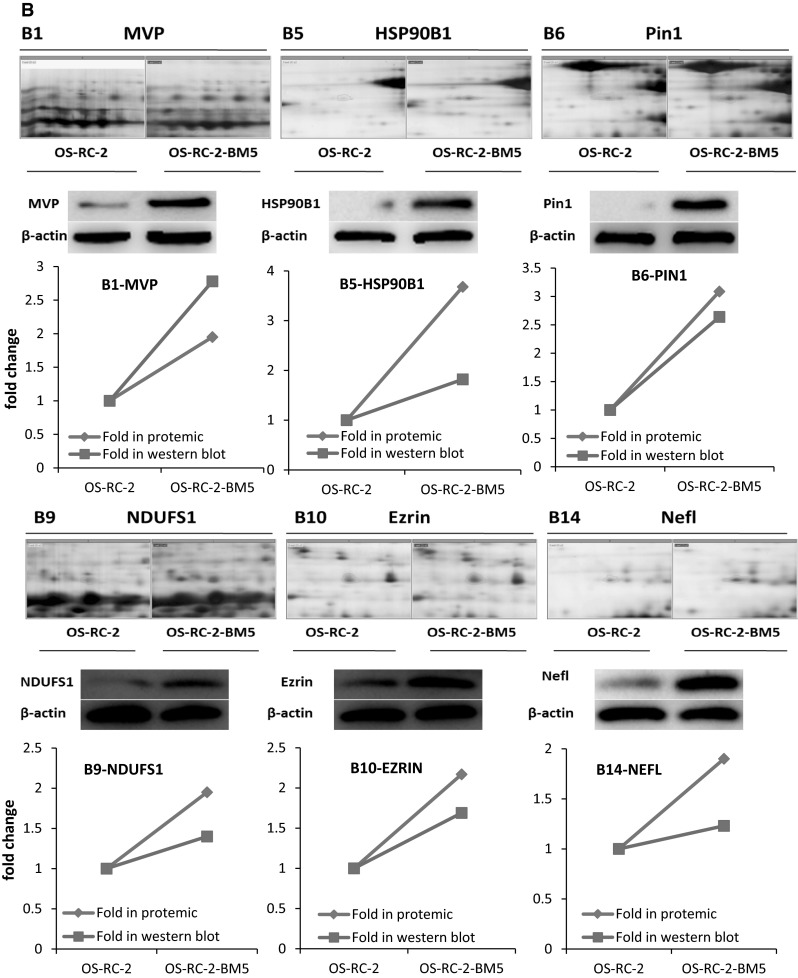
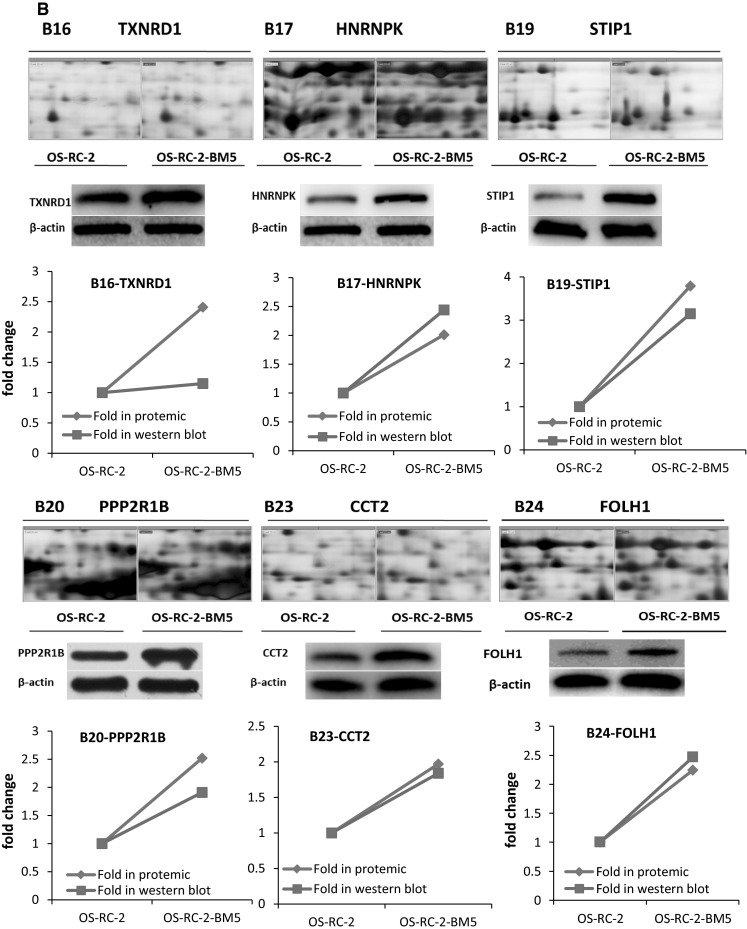
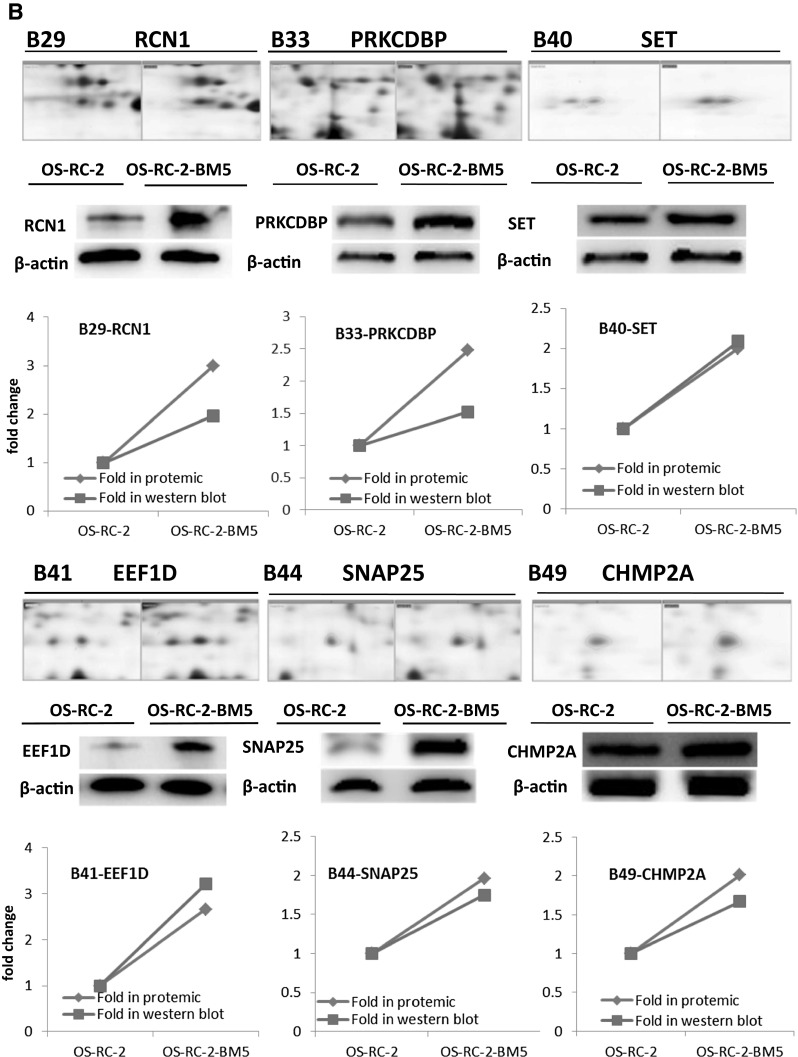
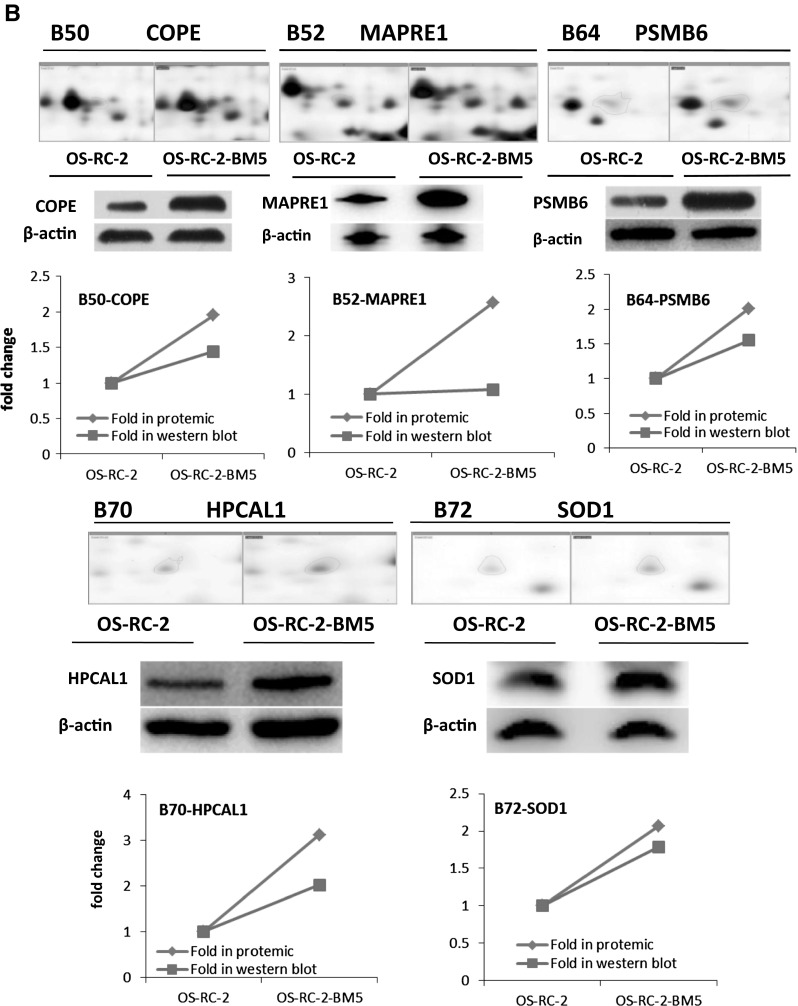
a The 2-DE gel showing the different spot intensities between OS-RC-2 and OS-RC-2-BM5. Among these altered proteins, 25 protein spots (P < 0.05) were noticeably down-regulated in the OS-RC-2-BM5 group (middle panel) and 75 protein spots (P < 0.05) were significantly up-regulated in the OS-RC-2-BM5 group on the right panel. b Results of quantitative Western blotting experiments performed for 26 proteins (change fold <0.5 and >1.9). The magnified images of protein spots from the 2-DE gels were shown on the upper part of each panel and the Western blot replicate results list below. The line charts showing the protein levels based on 2-DE and Western blot results in the bottom of panel
