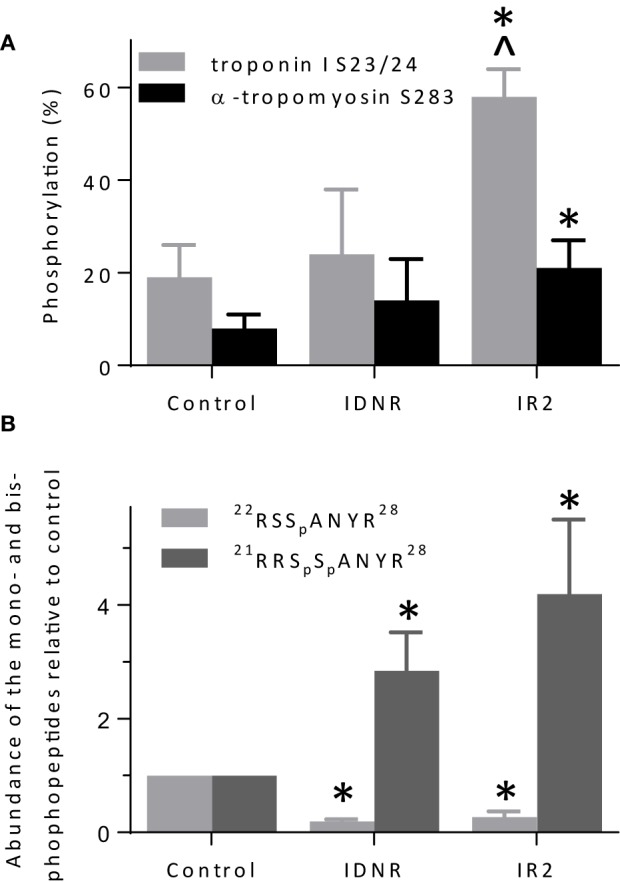
Figure 8.

Quantification of troponin I and α-tropomyosin phosphorylation. (A) Percent phosphorylation of troponin I serines 23 and/or 24 and tropomyosin serine 283 in native thin filaments isolated from control hearts, and hearts following global ischemia that did not survive attempted resuscitation (IDNR) or survived and were subject to 2 h reperfusion (IR2). (B) Levels of mono- (serine 24) and bis-phosphorylated (serines 23 and 24) troponin I relative to the control. Three dephosphorylated control and experimental samples were prepared from each heart. *p < 0.01 relative to control and ^p < 0.01 relative to INDR. The difference between IR2 and IDNR was p = 0.06 for tropomyosin phosphorylation.
