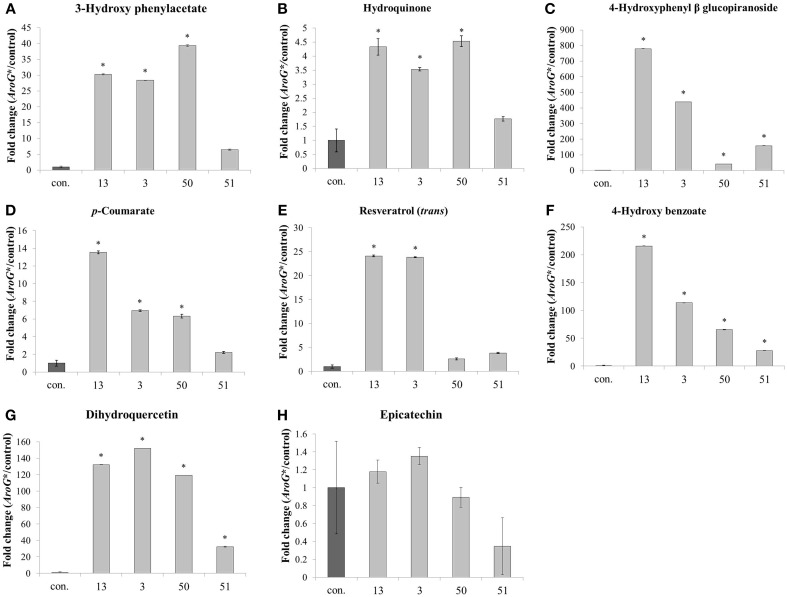
Figure 6.
Effect of AroG* transformation on the levels of AAA-derived specialized metabolites. Levels of metabolites [(A) 3-hydroxy phenylacetate, (B) hydroquinone, (C) 4-hydroxyphenyl β glucopiranoside, (D) p-coumarate, (E) resveratrol, (F) 4-hydroxy benzoate, (G) dihydroquercetin, and (H) epicatechin] are presented as fold change of AroG* line in comparison with the control line. Bars on top of the histograms indicate standard errors (In the control n = 6, including 3 samples from two lines, while in the AroG* lines, n = 3). Statistical significance was analyzed by One-Way ANOVA, followed by Dunnett's post-hoc test. Asterisks indicate P ≤ 0.05.

