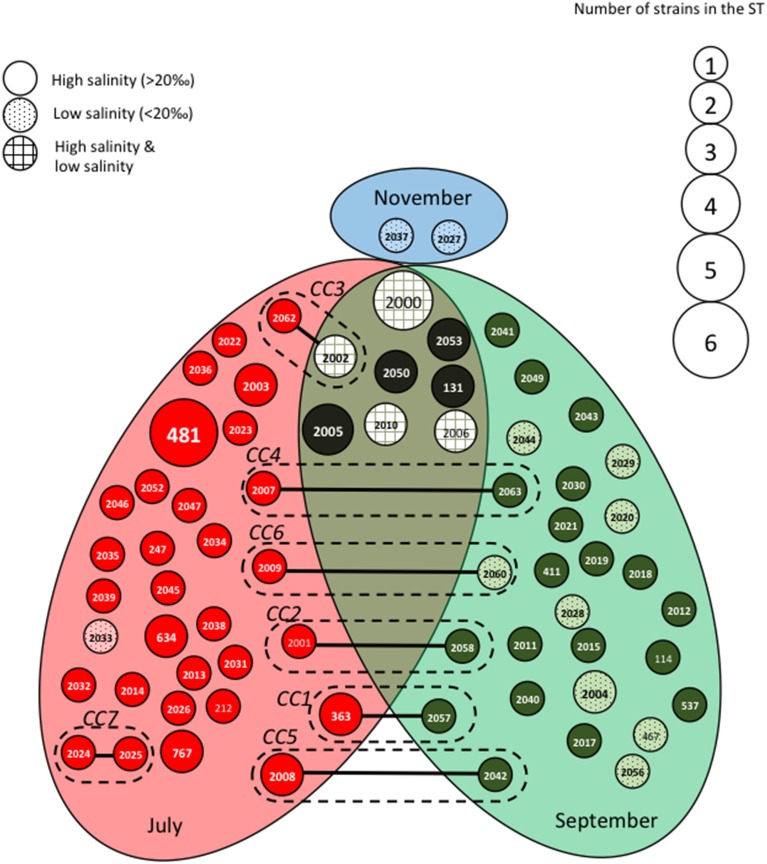
Figure 3.
Population structure of Vibrio parahaemolyticus based on MLST data after clustering by goeBURST software. Each Sequence Type (ST) is represented by a circle with a size proportional to the number of strains by ST. STs that differed by one (connected by full lines) or two (connected by dotted lines) alleles are considered to belong to the same clonal complex (CC), which is surrounded by a dotted line. Gray ellipses group ST collected at the same date in July, September or November. The gray background of the circles representing the STs is related to the salinity at the time of sampling.

