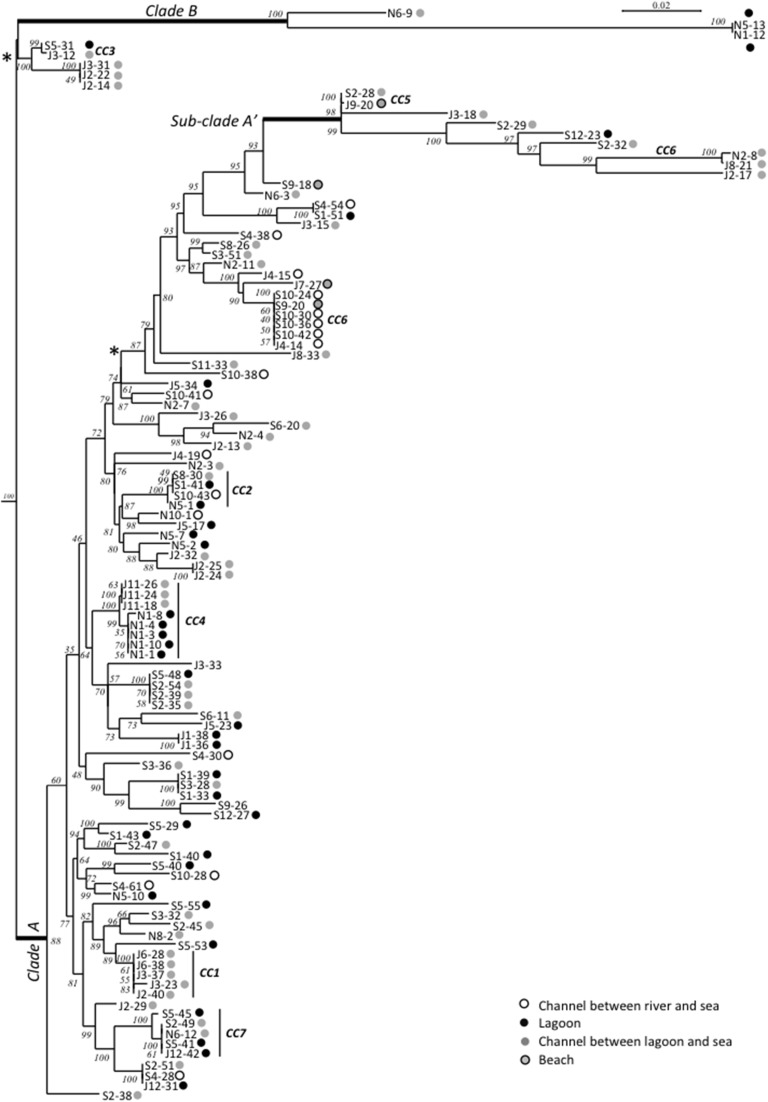
Figure 4.
Maximum-Likelihood tree based on concatenated sequences of the seven housekeeping gene fragments of the MSLT scheme indicating the relative placement of V. cholerae isolates. The numbers at the nodes are bootstrap values in %. V. mimicus ATCC 33653 was used as the out-group organism. Circles beside the isolate names correspond to the type of sampling sites as given in the color legend. The scale bar indicates the number of substitutions per nucleotide position. *branches submitted to long branches attraction artifact caused by sub-clade A' and B. When the tree was reconstructed without sub-clade A' and clade B sequences, the branches marked with asterisks took place inside the clade A without branching particularities.

