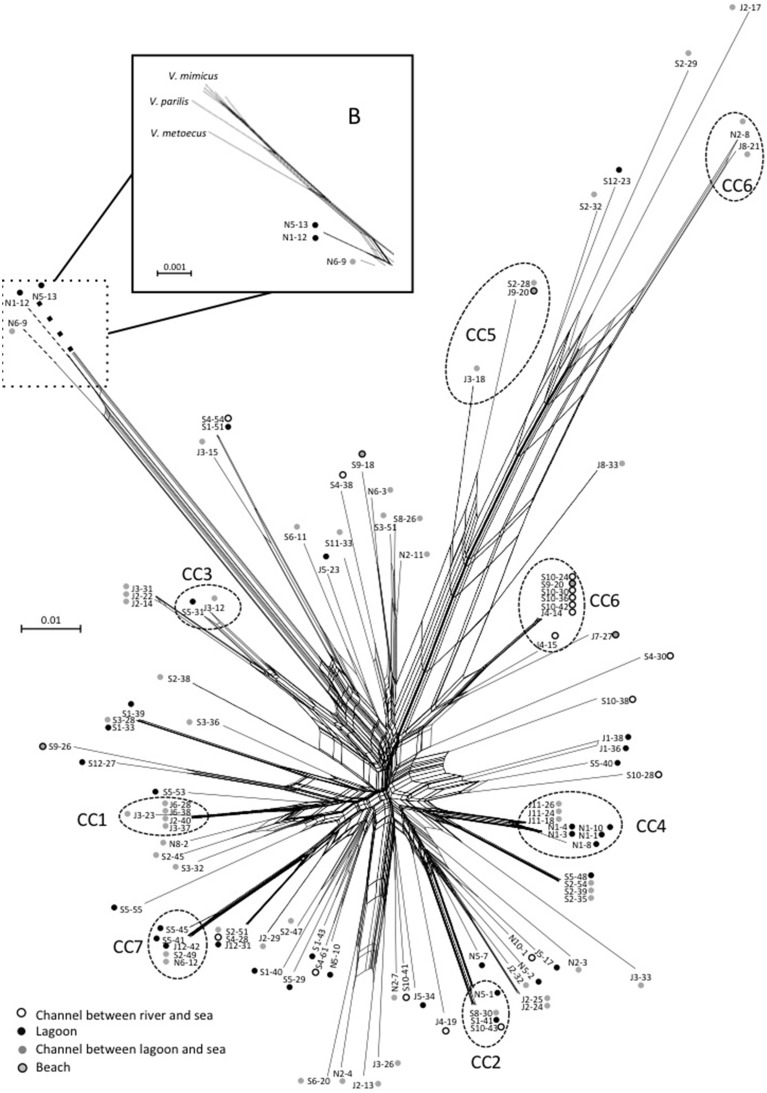
Figure 7.
Neighbor-net graph reconstructed from the concatenated sequences of the 109 strains of V. cholerae using Splits Tree 4.0. A network-like graph indicates recombination events. ST numbering and type of sampling site (as indicated in the legend) are shown at the branch tips. The position of V. metoecus, V. parilis, and V. mimicus regarding the emerging sub-clade B is indicated in the frame B. Dotted circles indicated clonal complexes as determined by goeBURST. The scale bars indicate the number of substitutions per nucleotide position.

