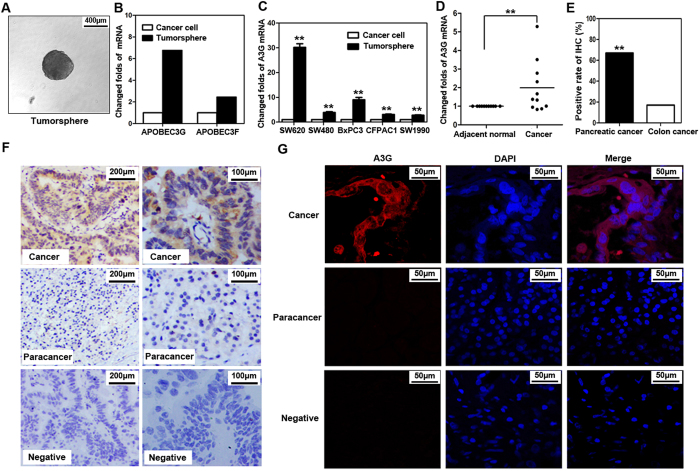
Figure 1. A3G is up-regulated in pancreatic cancer cells.
(A) Tumorsphere formation. SW620 cells were cultured with serum-free cloning media at 37 °C in a 5% CO2 atmosphere. Tumorspheres were observed after 7–10 days (Scale bar 400μm). (B) cDNA expression profile microarray screening. The APOBEC3 family (APOBEC3G and APOBEC3F) were up-regulated in tumorspheres compared with attached cancer cells in cDNA expression profile microarray screening. (C) Real-time qPCR quantification of A3G in cancer cells. The expression of A3G was analyzed using TaqMan real-time qPCR. A3G mRNA was higher in tumorspheres than in attached cancer cells. All data are represented for triplicate experiments (**P < 0.01, Student’s t-test). (D) The expression of A3G in pancreatic cancer tissues. Total RNA was extracted from 11 matched human pancreatic cancer and para-cancerous tissues and subjected to TaqMan real-time qPCR. The expression of A3G in pancreatic cancer tissues was higher than that in para-cancerous tissues (**P < 0.01, Student’s t-test). (E) Expression differences of A3G in colorectal and pancreatic cancer. The expression of A3G in pancreatic cancer was higher than colon cancer in immunohistochemical staining (**P < 0.01, χ2 test). (F) Immunohistochemical staining. Slides from 54 matched human pancreatic cancer and para-cancerous tissues were checked by immunohistochemical staining. The expression of A3G was higher in cancer tissues (ductal) than in para-cancerous tissues (acinar) (Left: Scale bar 200 μm; Right: Scale bar 100 μm). (G) Immunofluorescent staining. Representative immunofluorescent staining showed that A3G was higher in pancreatic cancer tissues and was mainly distributed in the cytoplasm (Scale bar 50 μm).

