Figure 2.

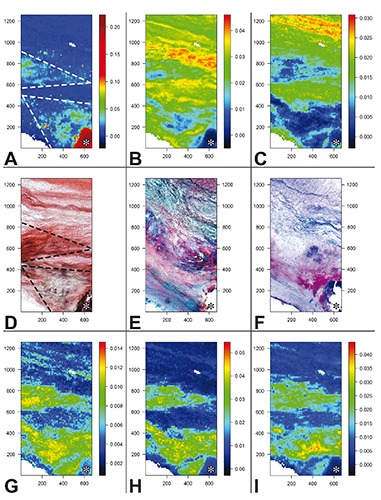
Images obtained from the Raman map showing the total normalized intensity of A) hydroxyapatite peak (959 cm–1); B) collagen peaks (877, 922, and 939 cm–1); C) elastin peaks (1103 and 1340 cm–1); G) phospholipid/triglyceride peaks (719 and 1738 cm–1); H) cholesterol peaks (700 and 741 cm–1); I) carotenoid peaks (1159 and 1527 cm–1). Color scale bars refer to arbitrary units of total normalized intensities. Histological pictures obtained from D) a serial cryosection subjected to von Kossa calcium staining and para-serial cryosections stained with E) Movat pentachrome method for extracellular matrix components or F) Nile blue method for neutral and acidic lipids. Two triangle-shaped regions are outlined (dashed lines in A and D) in which correlating features can be appreciated; these regions are promptly recognizable in all Raman images (A-C and G-I) and are referred as T1 and T2 regions in the text. A calcific nodule portion (asterisk) is displayed in the lower right corner. Histological slide original magnification: 5x. Abscissa and ordinate values are expressed in µm.
