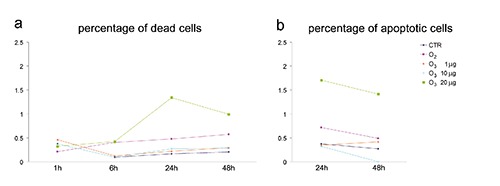
Figure 1.

Effect of O3 exposure on cell death and apoptosis. a) Mean values of dead cell and b) apoptotic cell percentage. The values are not significantly different from each other, although 20 µg O3/mL-treated cells show higher percentages; SE values have been omitted to improve graph readability.
