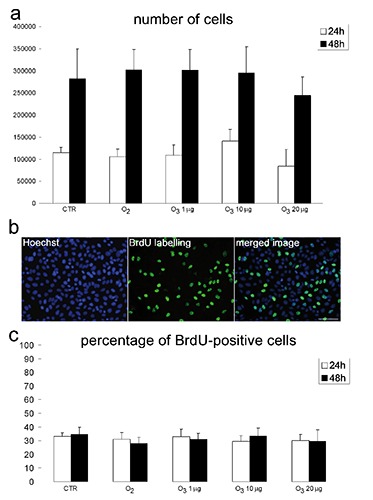
Figure 2.

Effect of O3 exposure on cell proliferation. a) Mean values±SE of cell number 24 h and 48 h post-treatment; no significant difference has been found among experimental groups at the same time. b) Representative fluorescence micrographs of HeLa cells after BrdU incorporation; scale bar: 50 µm. c) Mean values±SE of BrdU-positive cell percentage 24 h and 48 h post-treatment; no significant difference has been found among experimental groups.
