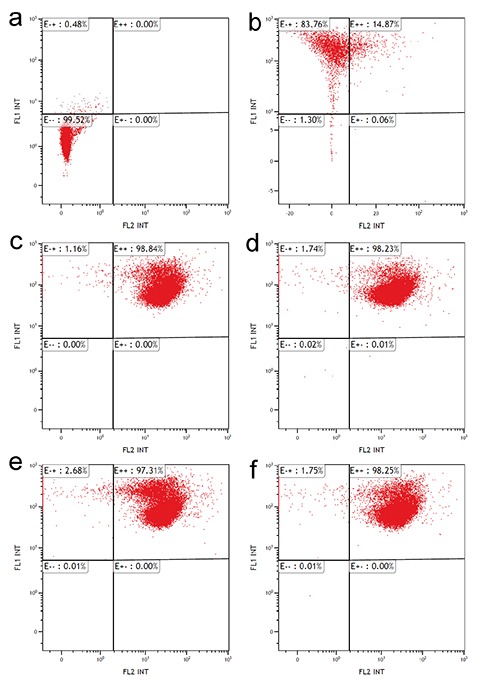
Figure 4.

Effect of O3 exposure on mitochondrial membrane potential: flow cytometry of mitochondrial staining with JC-1. Autofluorescence control (a), negative red positive green fluorescence control (b), double positive red/green fluorescence control (air-treated cells) (c), cells exposed to O2 (d), cells exposed to 1 µg O3/mL (e), and 10 µg O3/mL (f). Note the similar fluorescence distribution in c,d,e and f.
