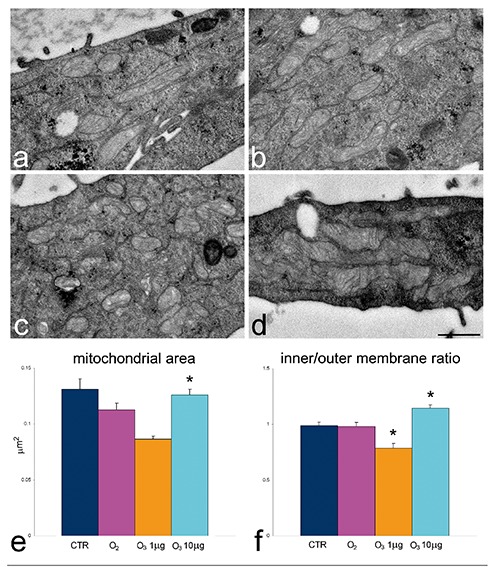
Figure 5.

Effect of O3 exposure on mitochondrial ultrastructure: transmission electron micrographs of CTR (a), O2 (b), 1 µg O3/mL-(c) and 10 µg O3/mL- (d) treated. In 1 µg O3/mL-treated cells mitochondria are small and contain scarce cristae whereas in 10 µg O3/mL-treated cells mitochondria are large with well developed cristae; scale bar: 500 nm. e,f) Mean±SE values of mitochondrial area and inner/outer membrane ratio; asterisks indicate values significantly different from each other.
