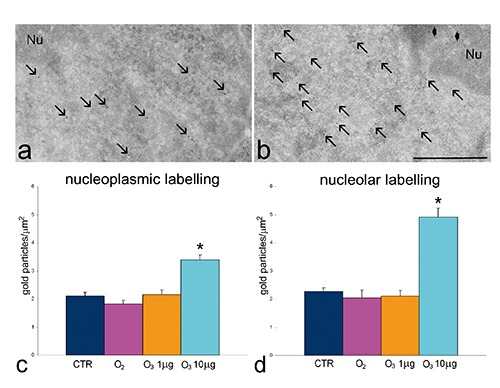
Figure 6.

Effect of O3 exposure on RNA transcription: representative transmission electron micrographs of CTR (a) and 10 µg O3/mL-treated cells (b) labelled for BrU; BrU molecules have been incorporated in perichromatin fibrils (arrows) and in the nucleolar dense fibrillar component (arrowheads); Nu, nucleolus; scale bar: 500 nm. c,d) Mean±SE values of BrU labelling density evaluated on nucleoplasm and nucleoli of cells incubated with BrU 24 h post-treatment; asterisks indicate values significantly different from each other.
