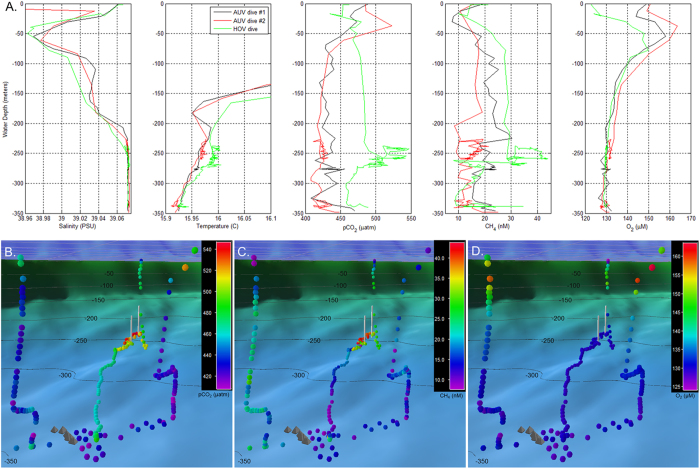
Figure 2. Water column profile data recorded during AUV and HOV survey operations.
A. Water column profiles of salinity, temperature, carbon dioxide partial pressure, and dissolved methane, and dissolved oxygen distributions recorded during two initial AUV reconnaissance dives and the subsequent HOV investigation dive. Anomalies are visible in the 270 to 230 meter depth range. B., C. and D. show geo-referenced pCO2, methane, and dissolved oxygen distributions respectively, recorded during the AUV and HOV dive missions. Colored circles indicate dissolved chemical concentrations with corresponding color bar key located in the upper right. Chemical measurements are shown as viewed from the Santorini North Basin, above the center of inflation, looking toward the Kolumbo volcano. Gray pyramid-shaped icons indicate locations of hydrothermal vent mounds identified within the North Basin during prior ROV dive operations; white vertical lines indicate the uppermost and lowermost locations of the Kallisti Limnes on the caldera wall. The dark blue color field with gray grid in the upper portion of B., C., and D. indicates the sea surface.

