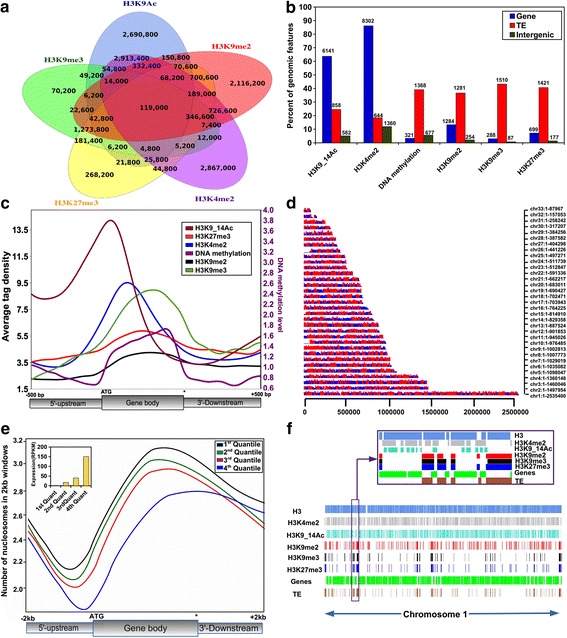
Fig. 2.

Distribution of ChIP-Seq signal peaks for H3K4me2, H3K9_14Ac, H3K9me2, H3K9me3, and H3K27me3. a Venn diagram showing the overlap (in base pairs) of histone marks with each other. b Percentage of genomic features (genes, TEs, and intergenic regions) found enriched for each of the marks. The numbers above each bar refer to total number of peaks overlapping genes, TEs or intergenic regions. c Enrichment profile of H3K4me2, H3K9_14Ac, H3K9me2, H3K9me3, H3K27me3 along genes (upstream 500 bp, coding region, downstream 500 bp). Average tag density is the number of sequence reads per gene. Note that the small rise in enrichment seen in the flanking regions (both at 5′ and 3′ ends) is a result of the presence of nearby genes in the densely packed genome. d Genome-wide nucleosome distribution. The color code refers to the level of enrichment, blue being low and red high. e Nucleosome occupancy along genes and flanking regions and its correlation with gene expression quantiles (Reads Per Kilobase Per Million, RPKM). f A snapshot of chromosome 1, showing the six epigenetic modifications within genes and TEs
