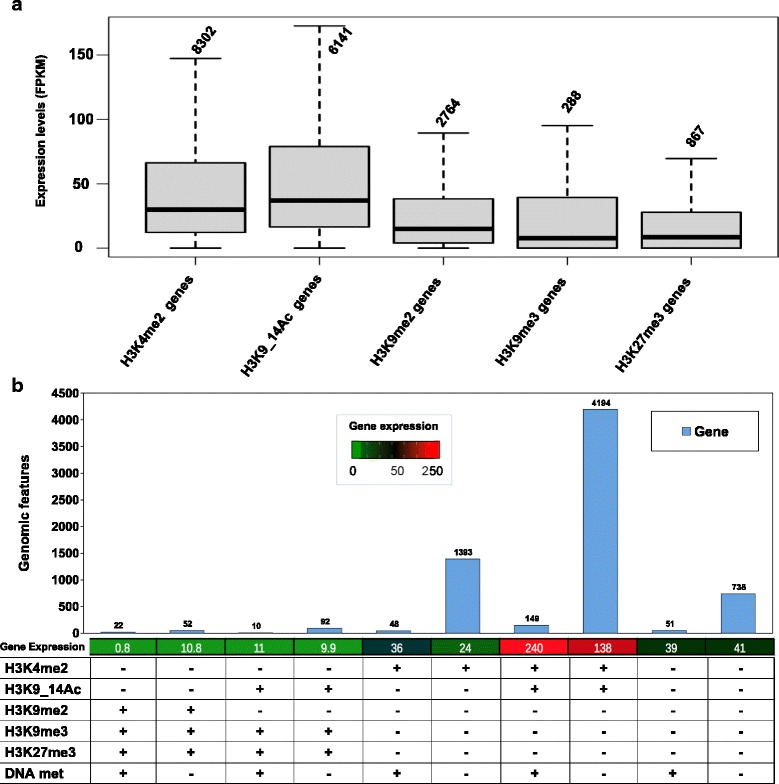
Fig. 3.

Comparison of the presence of histone marks with gene expression. a Boxplots showing the gene expression profiles correlating with each histone mark. Gene expression was quantified in standard growth conditions using RNA-Seq data. Around 85 % of genes are expressed and quantified as fragments per kilobase of exons per million reads mapped (FPKM). Number of genes is indicated above each bar. b Combinatorial effects of histone modifications and DNA methylation on gene expression. FPKM values are indicated below each bar
