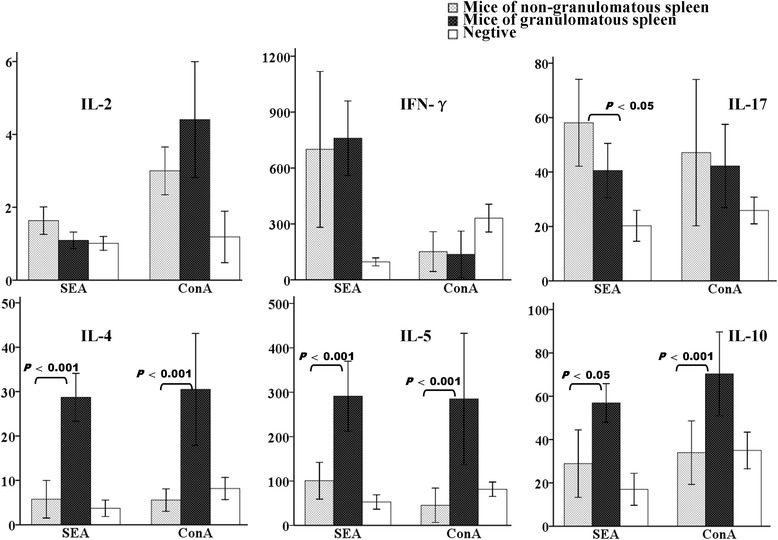
Fig. 4.

Cytokine responses in infected mice at 18 weeks post-infection stimulated by SEA or conA. Groups are mice with granulomatous spleens (n = 7), non-granulomatous spleens (n = 8) and naïve mice (n = 8). Bars indicate means ± standard deviations and statistically significant differences between the compared groups are shown as p-values
