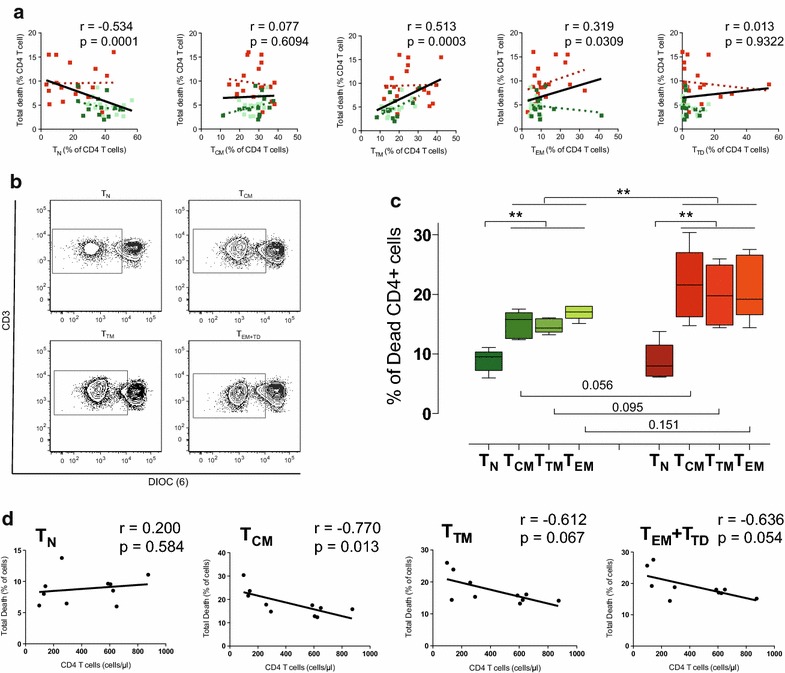
Figure 2.

Association of CD4 T-cell maturation with CD4 T-cell death. a Relationships between the frequencies of the different CD4 T-cell subsets was plotted against spontaneous intrinsic CD4 T-cell apoptosis. Data from immunodiscordant (n = 23, red), low nadir immunoconcordant (n = 17, dark green) or high nadir immunoconcordant individuals (n = 16, light green) are shown with color-coded linear regression for each data set. Linear regression for the global data is shown by black lines. Correlation coefficients and p values of Spearman’s test for the global analysis are shown in each plot. b Spontaneous cell death was assessed in sorted TN, TCM, TTM, TEM/TTD CD4 T cells stained with the potentiometric probe DIOC(6). Dot plots of DIOC(6) and CD3 staining for a representative individual show the percentage of dead cells in the left (DIOC low) gate. c The level of spontaneous cell death in sorted TN, TCM, TTM, TEM+TD T cells from immunoconcordant (green, n = 5) or immunodiscordant (red, n = 5) treated HIV infected individuals are shown. Figure shows median values (bands), IQR (boxes) and 10-90 interquartile values (whiskers). Asterisks denote significant differences (non parametric permutation or Mann–Whitney tests). d Correlations of cell death sorted TN, TCM, TTM and TEM/TTD CD4 T cells with absolute counts of circulating CD4 T cells. Correlation coefficient and p values (Spearman) are shown in each graph.
