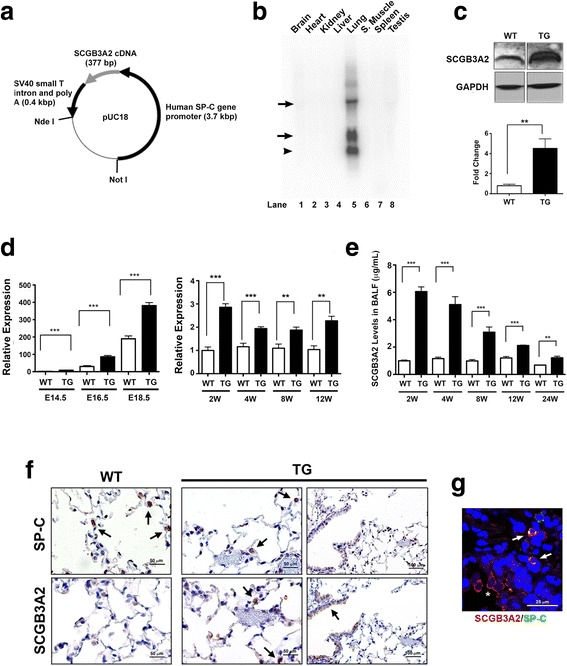
Fig. 1.

Generation of the SCGB3A2 transgenic mouse line. a Illustration of the construct showing the human SP-C gene promoter cloned into the pUC18 vector with SV40 small T intron and poly A. b Northern Blot analysis. The high level of Scgb3a2 is observed only in lung tissue. The bands indicated by an arrow represent exogenously expressed Scgb3a2 mRNAs. The highest mobility band shown by an arrowhead is derived from endogenous Scgb3a2. c Representative Western blot result showing increased level of SCGB3A2 protein in Scgb3a2-transgenic mouse lungs as compared with wild-type mice. GAPDH was used as a loading control. Lower panel shows the result of quantitation, normalized to GAPDH. N = 3. d qRT-PCR analysis of relative expression levels of Scgb3a2 in lungs of various gestational days and ages of wild-type (WT) and transgenic (TG) mice. e SCGB3A2 levels in BALF of different ages of WT and TG mice. For D, E: N = 5 in each group. The results are shown as the mean ± SD. **P < 0.01, ***P < 0.001 by student t-test in comparison between WT and TG. f Immunohistochemistry for SP-C and SCGB3A2 in 4-month-old WT and TG mouse lungs. Arrows indicate representative positive signals in brown. TG lungs express SCGB3A2 in alveolar type II cells (middle panel) in addition to airway epithelial cells (right panel). Scales are as indicated. g Co-immunofluorescence analysis of TG mouse lungs for SP-C and SCGB3A2. Airway cells express only SCGB3A2 (red, shown by an asterisk) while alveolar type II cells express both SP-C and SCGB3A2 (yellow, shown by arrows). Scales are as indicated
