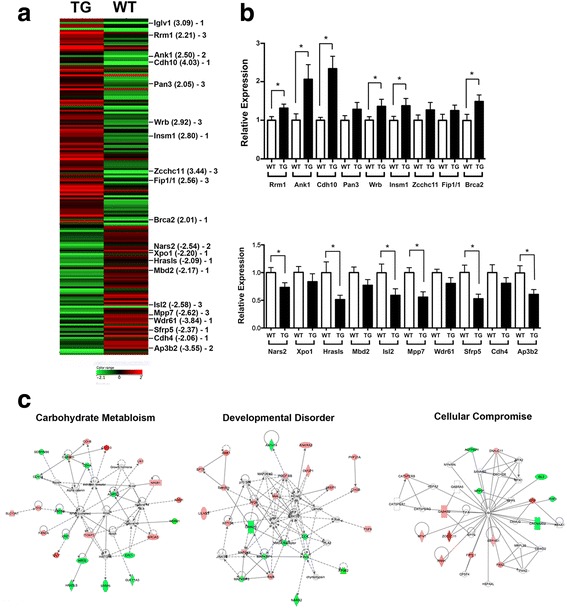
Fig. 5.

Microarray analysis. a Heat map diagram of differentially expressed genes in normal Scgb3a2-transgenic (TG) lungs vs. wild-type (WT) lungs. All genes >2 fold with P < 0.05 differences were used for the analysis. The average of 4 samples in each group is shown. Green and red indicate down- and up-regulation of gene expression, respectively. The scale is shown at the bottom. Genes found in top three pathways as shown in C are indicated with the fold differences in parenthesis. The number (1, 2, or 3) means the pathway to which indicated genes belong in C. b qRT-PCR analysis of highly up- or down-regulated genes indicated in A using RNAs isolated from untreated WT and TG mouse lungs. The results are shown as the mean ± SD. N > 6, *P < 0.05 by student’s t-test. c Top three pathways, Carbohydrate metabolism (pathway 1), Developmental disorder (pathway 2), and Cellular compromise pathways (pathway 3) determined by Ingenuity Pathway Analysis using genes identified by microarray analysis that have >1.5 fold with P < 0.05 differences
