
Fig. 3.
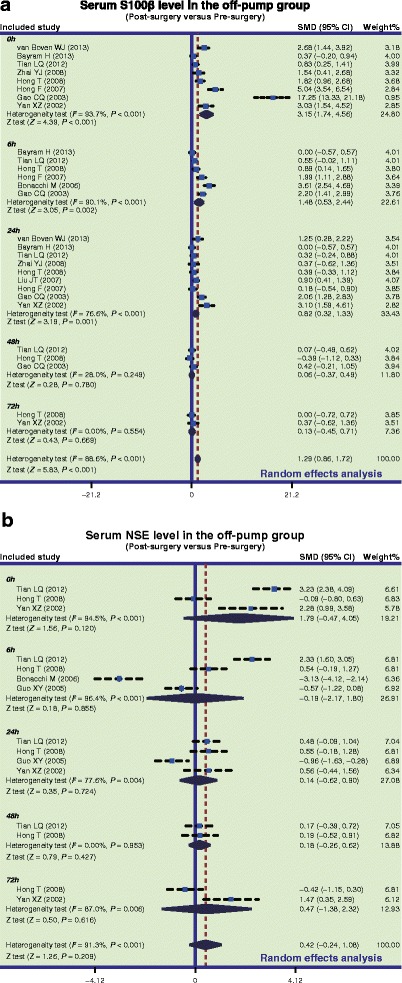
Forest plots for the differences in serum S-100 beta (S-100β) and neuron specific enolase (NSE) levels between before and after surgery in the off-pump groups (a: S-100β; b: NSE; SMD: standardized mean difference; CI: confidence interval)
Official websites use .gov
A
.gov website belongs to an official
government organization in the United States.
Secure .gov websites use HTTPS
A lock (
) or https:// means you've safely
connected to the .gov website. Share sensitive
information only on official, secure websites.
Forest plots for the differences in serum S-100 beta (S-100β) and neuron specific enolase (NSE) levels between before and after surgery in the off-pump groups (a: S-100β; b: NSE; SMD: standardized mean difference; CI: confidence interval)