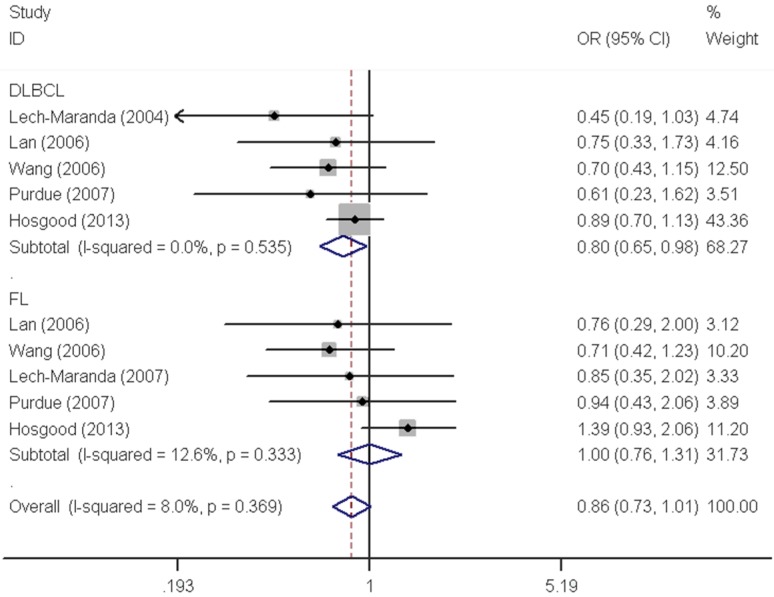
Figure 2.
Forest plot of NHL risk associated with the IL10 -819C>T polymorphism by subtypes under recessive model. For each study, the estimates of OR and their corresponding 95% CI were plotted with a box and a horizontal line. The symbol filled diamond indicates pooled OR and its corresponding 95% CI.

