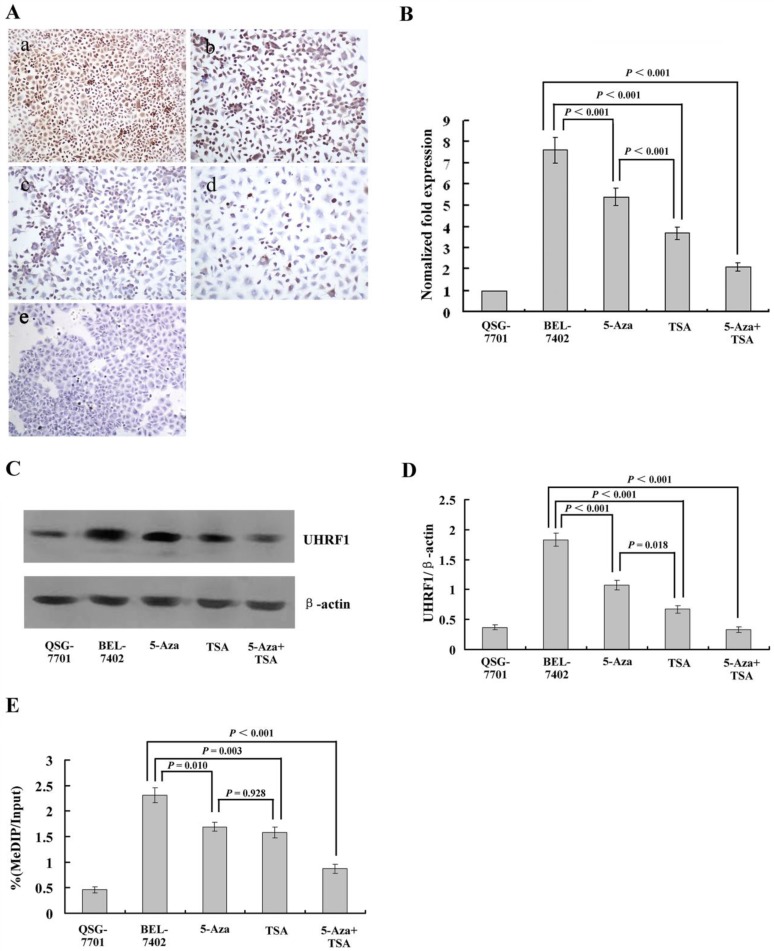
Figure 3.
(A) Immunohistochemical analysis of UHRF1 protein expression in HCC cells with or without 5-Aza-CdR and/or TSA treatment. (a) Untreated HCC cells; (b) after 5-Aza-CdR treatment; (c) after TSA treatment; (d) after 5-Aza-CdR and TSA combined treatment; (e) Untreated normal liver cell line QSG-7701 cells. (B) qRT-PCR analysis of UHRF1 mRNA expression (C, D) Western blot analysis of UHRF1 protein expression; the ratio of UHRF1 to β-actin is shown on the y-axis. (E) Chromatin immunoprecipitation (ChIP)-quantitative real time PCR (qPCR) assay for UHRF1 on the 3OST2 promoter. Shown is the enrichment, relative to the input obtained in each ChIP sample.

