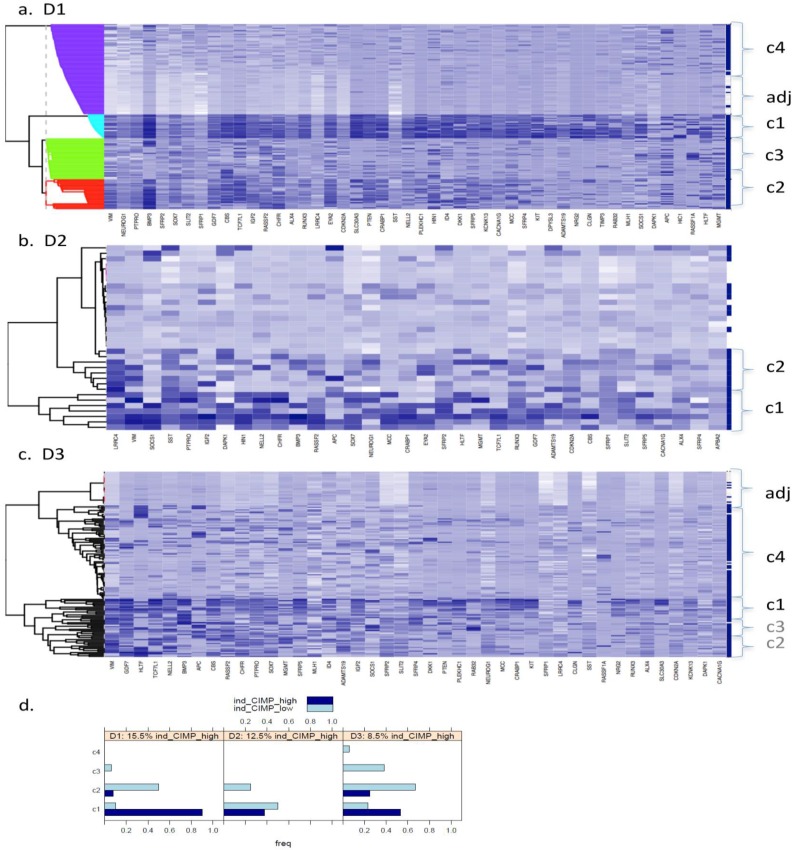
Figure 1.
Bayesian clustering (BC) for the selected list of genes for the 3 GEO array-based datasets. BC orders the genes according to their importance in discriminating between tissue types. Each row represents the methylation levels of the considered genes for the same tissue, while each columns represents the methylation levels of many tissues for the same gene. Darker shades on the heatmaps indicate higher methylation levels, while the right-hand side vertical bar indicates the tumour tissues in dark-blue and the normal-looking adjacent tissues in white. a) Dataset D1 b) Dataset D2 c) Dataset D3. All heatmaps contain the same ratio of tumours to healthy adjacent tissues. d) Frequency of indicative CIMP-status, calculated from the Illumina array-based data as indicated in Materials and Methods, for tissue clusters obtained by Bayesian Clustering on D1, D2, D3.

