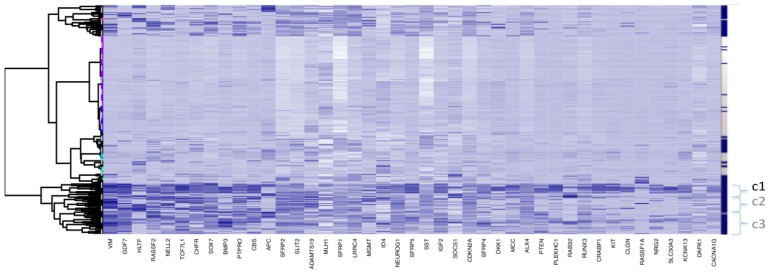
Figure 2.
Clustering for Dataset 3 (all 118 adjacent healthy tissue samples included). Bayesian Clustering (BC) performed on D3 with all 118 available adjacent samples included. Comparing sample content of clusters with those from Fig. 1c (subset of adjacent healthy tissue samples only included), the overlap in c1 is about 70% and, for c2 and c3 taken together - about 80%. Both c2 and c3 correspond to intermediary methylated tissues and the boundary between these clusters is very fuzzy, as they swap samples from Fig 1c to this figure.

