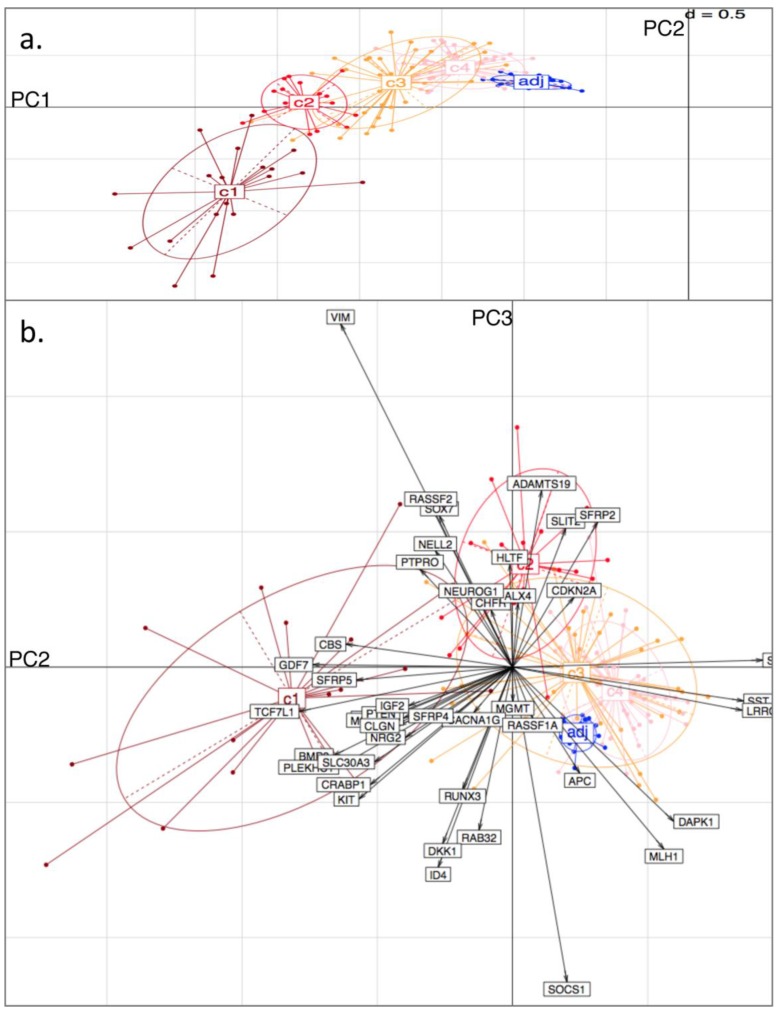
Figure 4.
Principal Component (PC) Analysis on D3. Showing a) PC1 and PC2, with tissue-type clusters clearly shown and in agreement with Bayesian Clustering (BC) and b) PC2 and PC3. Tissue samples are represented by dots and genes by labelled arrows. The c1 to c4 and 'adj' groupings correspond to the subclusters obtained in the previous BC analysis.

