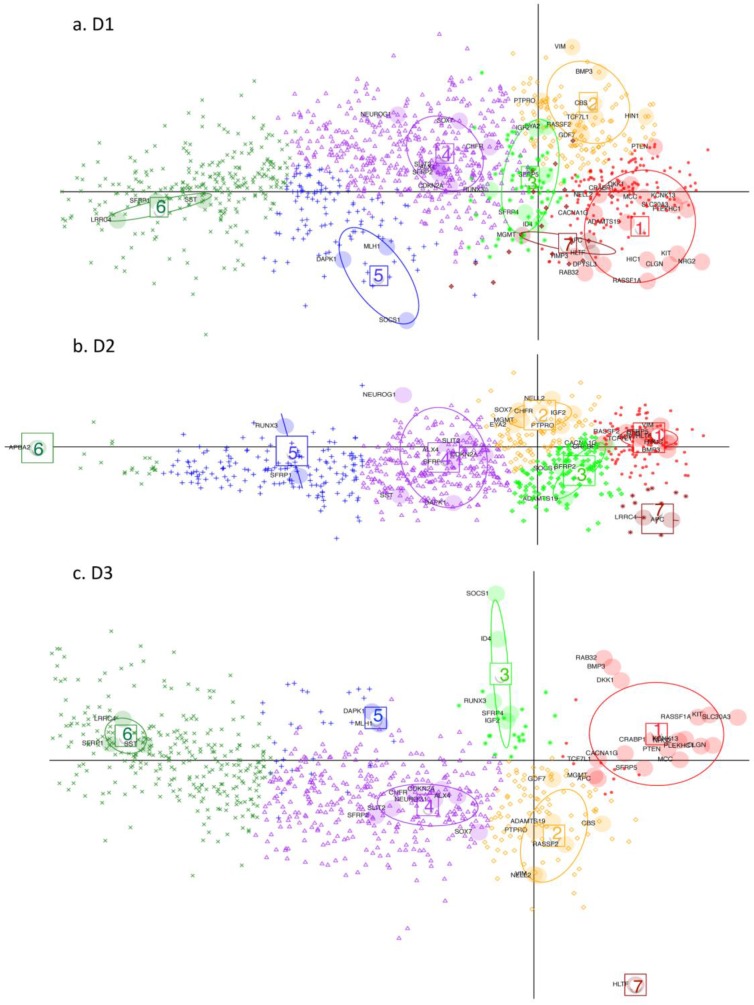
Figure 5.
DAPC (Discriminant Analysis based on Principal Component Analysis). Performed on D1, D2 and D3 respectively (GEO datasets). Key: Large shaded circles correspond to genes from the initial subset list. Small symbols indicate membership to different gene clusters, as determined by the discriminant functions, for the rest of the genes from the respective datasets. Resulting gene-clusters with similar relative locations on the plan, are annotated from 1 to 7 in the three datasets. Thus gene-cluster g4 here implies that member-genes have a similar position on the plan relative to the other gene clusters across the 3 datasets. Gene cluster 7 is very small hence is not considered in the subsequent discussion. Note how this time it is the genes which are projected on the plane defined by the first 2 discriminant functions (DF) (as opposed to the tissues being projected on the planes defined by the principal components (PC) in Fig. 3 and 4).

