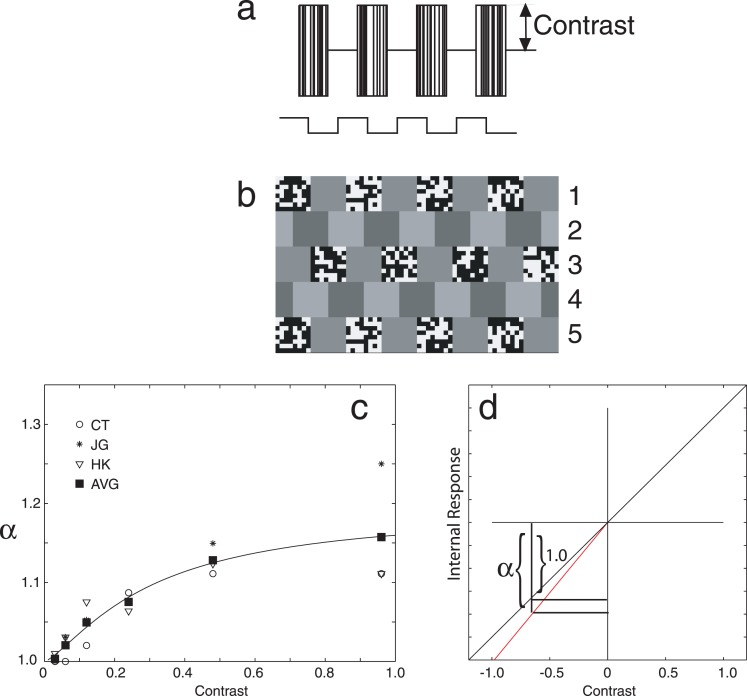
Figure 11.
Measuring perceptual black–white asymmetry α as a function of stimulus contrast. (a) Intensity profiles of one texture frame and one luminance frame of the motion stimulus. (b) Slices of five consecutive frames of the motion stimulus. (c) The data of Experiment 12 and the continuous derived function αc(c) as a function of stimulus contrast. (d) A possible internal representation of contrast that is consistent with αc(c).

