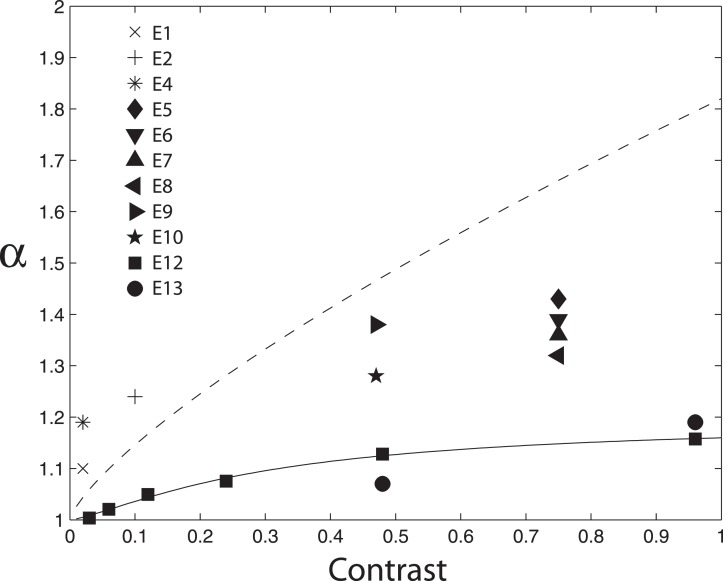
Figure 14.
Estimated α values versus stimulus contrast in the twelve experiments. Each plotted data point is the mean α value for all the observers in the particular experiment. The solid curve represents Equation 4, an empirical fit to the data of Experiment 12. The dotted curve represents the power-law relationship between α and contrast derived for the data of He and MacLeod (1998).

