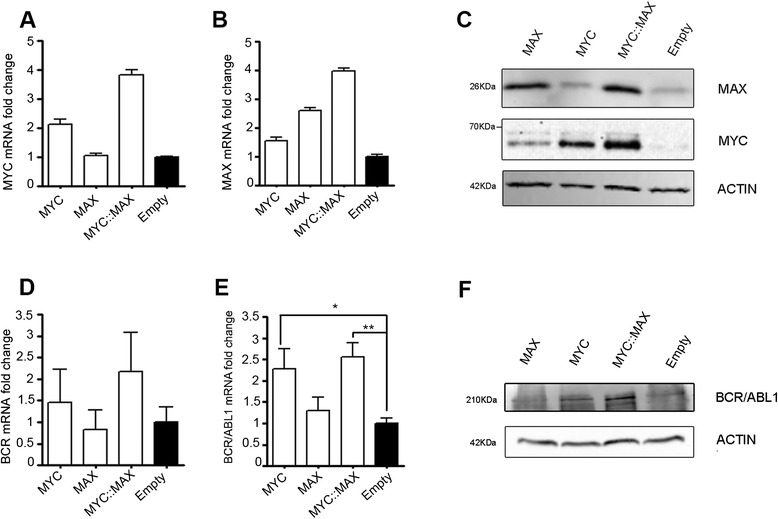
Fig. 2.

Effect of MYC and MAX on BCR and BCR/ABL1 expression in K562 cell line. MYC (a,c) and MAX (b,c) over-expression in K562 cells stably transfected with MAX, MYC, or pcDNA3 empty vector (Empty) or MYC/MAX (MYC::MAX), as evidenced by RTq-PCR (a,b) and Western Blot from total lysates (c). RT-qPCR (d,e) and Western Blot (f) show BCR and BCR/ABL1 expression levels in K562 transfectants. Actin was used as loading control. The RTq-PCR data shown in (d,e) represent the means ± SD (standard deviation) of three independent experiments. Data are represented as mRNA fold change compared to the Empty sample
