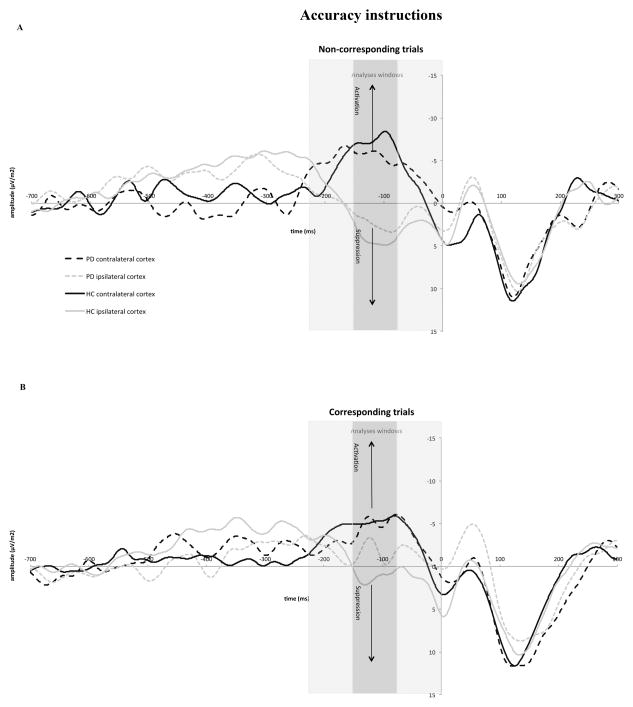
Figure 7.
Response-locked movement-related brain potential (MRP) activity recorded at C3 and C4 under accuracy instructions for non-corresponding (panel A) and corresponding (panel B) responses. As in Figure 6, gray bars represent the different windows used in the data analyses to capture activation and inhibition processes before the correct response was emitted (−225 to −150 ms. −150 to −75 ms, and −75 to 0 ms). The window used in the primary analyses was −150 to −75 ms.

