Fig. 1.

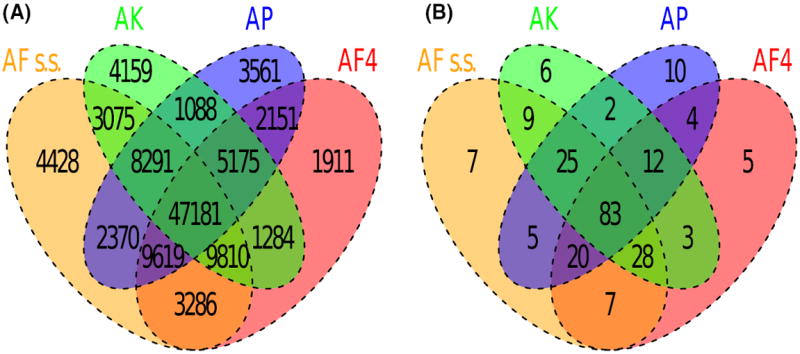
Multiple-alignment statistics. The Venn diagrams summarize (A) the number of alignment blocks >500 bp generated for all species combinations, and (B) the total number of aligned base pairs represented in these blocks (in millions).

Multiple-alignment statistics. The Venn diagrams summarize (A) the number of alignment blocks >500 bp generated for all species combinations, and (B) the total number of aligned base pairs represented in these blocks (in millions).