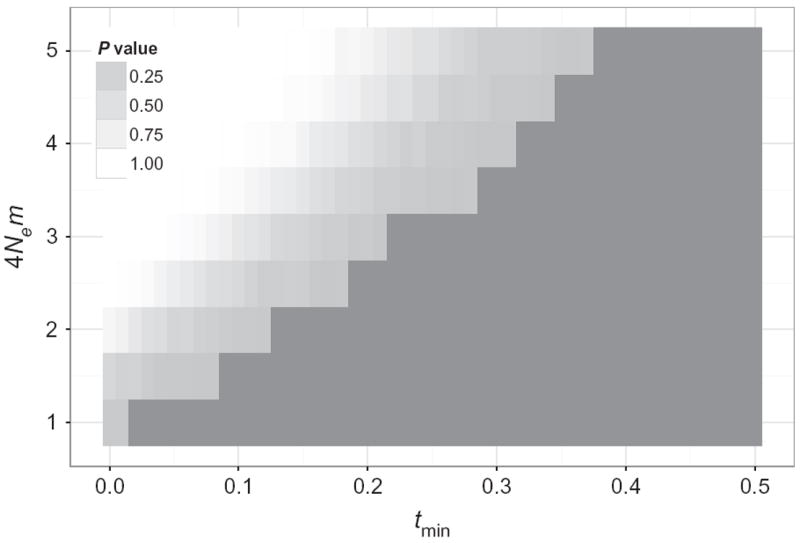
Fig. 2.

Amount and age of gene flow that can be excluded given the number of shared polymorphisms observed. The figure shows the probability that introgression would lead to significantly more shared polymorphisms than observed based on the amount of gene flow (y-axis, in 4Nem) and time since the last gene flow (x-axis, in 4Ne generations). The white surface in the graph represents combinations of parameters that are incompatible with the data observed. Note that this analysis assumes that all shared polymorphisms were genuine (i.e. not sequencing errors) and therefore likely overestimates possible gene flow.
