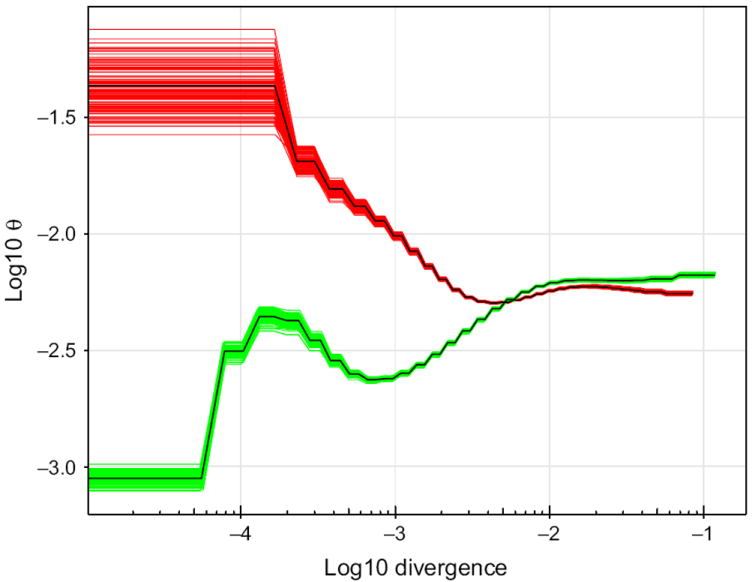
Fig. 3.

Demographic histories of AF4 and AP. The figure shows the estimated historical variations in effective population size for AF4 (green) and AP (red) based on PSMC analyses. The composite green (AF4) and red (AP) lines represent 100 bootstrap replicates. The y-axis represents the population mutation rate (in log10 of θ), and the x-axis represents the log10 pairwise sequence divergence.
