
Figure 1.
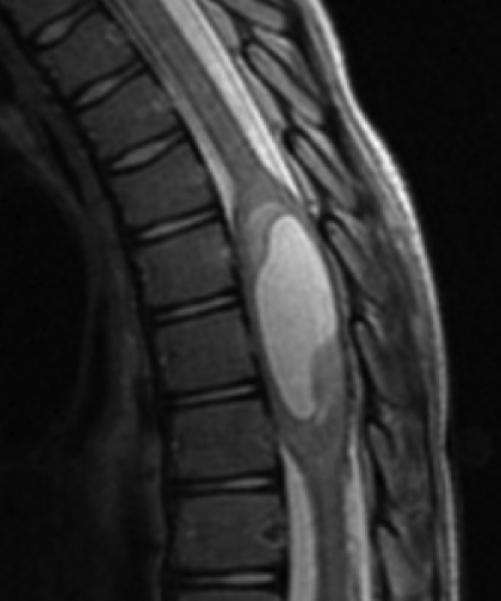
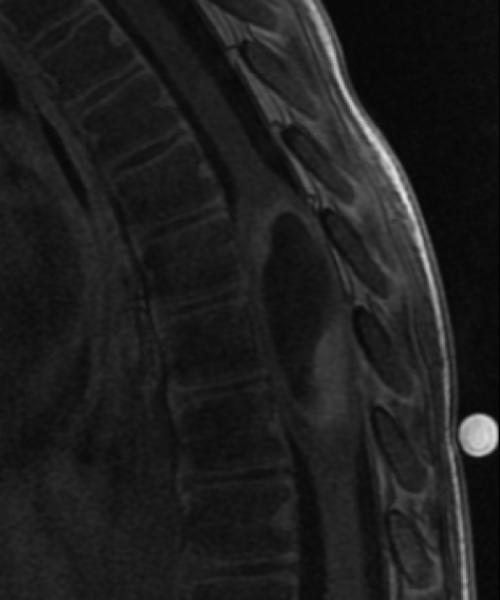

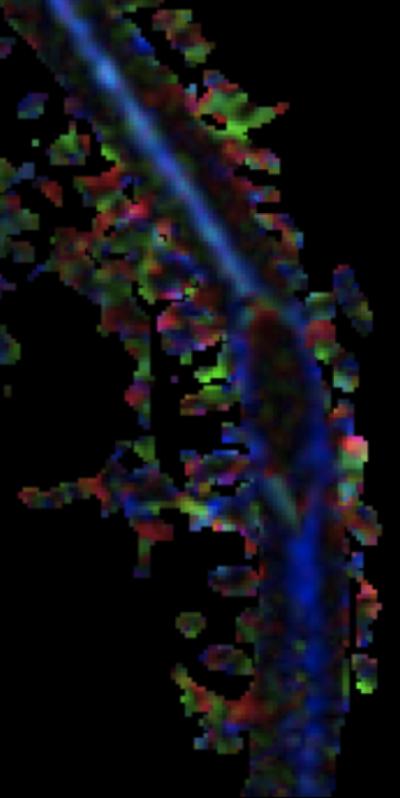
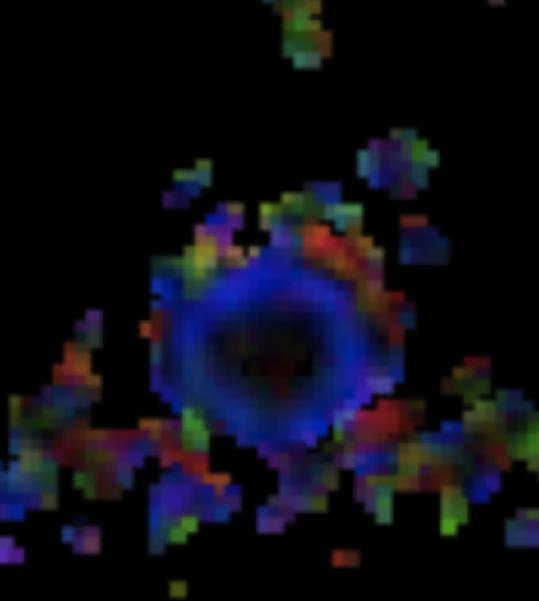
A: Sagittal T2W image of the mid-thoracic spinal cord shows a cystic ISCN spanning the T7 through T9 levels. B: Sagittal T1W post-contrast image shows a thin peripheral rim of enhancement with a nodule along the posterior/inferior aspect and focal thickening along the anterior/superior aspect of the cyst. C: Sagittal trace image from diffusion tensor imaging. Sagittal (D) and axial (E) DE-FA map of the thoracic cord. F: Lateral projection DT-FT image showing continuity of fiber tracts from above to below the mass, which are peripherally deviated as they traverse the lesion