
Fig. 5.
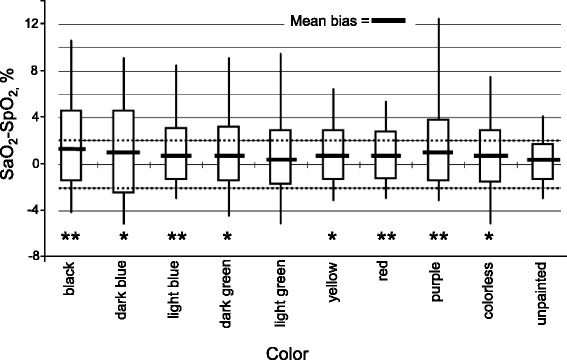
Bias of O2 saturation pulse oximetry (SpO2) and arterial O2 saturation (SaO2) of various nail polish colors in critically ill patients. Thick horizontal lines represent mean bias, the whiskers represent maximum and minimum bias; the bottom and top of the boxes represent the first and third quartiles. *P < 0.05 ,**P < 0.01 when compared with arterial oxygen saturation. Reprinted with permission from Elsevier Inc. [29]