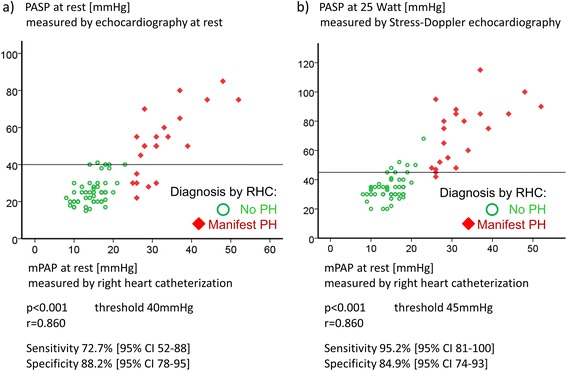
Fig. 2.

a Correlation of systolic pulmonary arterial pressures (PASP) determined by echocardiography and mean pulmonary arterial pressure (mPAP) at rest. The x-axis shows the PASP values measured by echocardiography at rest, the y-axis the values measured by right heart catheterisation (RHC). The values of each patient are given in red, indicating that the assessment including RHC diagnosed a manifest pulmonary hypertension (PH) with an mPAP at rest of at least 25 mm Hg. The symbols in green are the values of systemic sclerosis patients with no manifest PH at rest. As cutoff value for the PASP, 40 mm Hg at rest was used. The sensitivity was 72.7 % (95 % confidence interval (CI) 52–88 %) and the specificity was 88.2 % (95 % CI 78–95 %) in diagnosing a PH (P < 0.001). There was a positive correlation (r = 0.860) between PASP and mPAP. b Correlation of PASP at 25 Watts and mPAP at rest. The x-axis shows the PASP values measured by echocardiography during low-dose exercise at 25 Watts. The y-axis shows the values measured by RHC at rest. Sensitivity was 95.2 % (95 % CI 81–100 %) and specificity was 84.9 % (95 % CI 74–93 %) in diagnosing a PH using a cutoff PASP value of 45 mm Hg at 25 Watts (P < 0.001). Positive correlation (r = 0.860) between PASP at 25 Watts and mPAP
