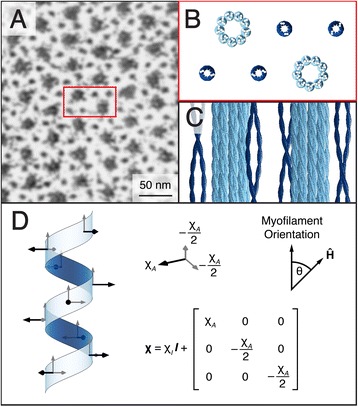
Fig. 1.

Microstructural and mathematical basis of the myofilament model. a An electron microscope image of a cross-section of the sarcomere highlights the myofilament lattice in myocardial tissue (image courtesy of Margaret Goldstein, PhD, Baylor College of Medicine and Robert Perz-Edwards, PhD, Duke University). b A cross-sectional rendering of the myofilament model volume represents a unit that repeats throughout the sarcomere. c Thick (light blue) and thin (dark blue) filaments are represented in the model volume by secondary and tertiary α-helical structures. The F-actin is not represented in the model volume due to the less coherent organization of α-helices within actin subunits. d Bond locations and susceptibility tensors are defined according to the molecular structure of the α-helix. There is an average of 3.6 peptide bonds per helix repeat
