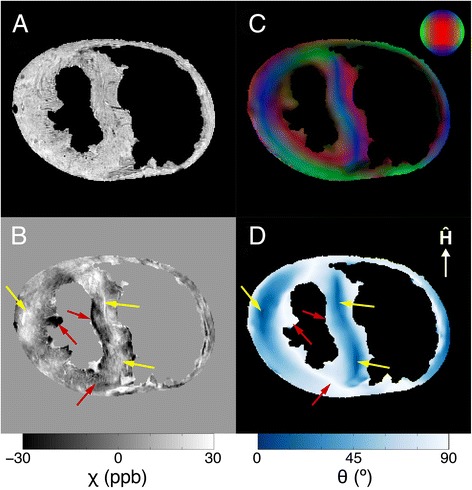
Fig. 4.

Correlation between apparent magnetic susceptibility and myofiber orientation in a typical specimen. Anatomical reference image created by averaging GRE magnitude data from echoes 1–4 (a). Mean magnetic susceptibility map calculated from multi-echo GRE image phase data (b). DTI myofiber orientation map that has been weighted by the fractional anisotropy and converted into red/green/blue values, where blue indicates the magnetic field direction (c). The major eigenvector of the DTI data was used to calculate the myofiber angle relative to the magnetic field direction (d). Yellow arrows indicate myofibers that are nearly parallel to B0 and more paramagnetic. Red arrows indicate myofibers that are nearly perpendicular to B0 and more diamagnetic
