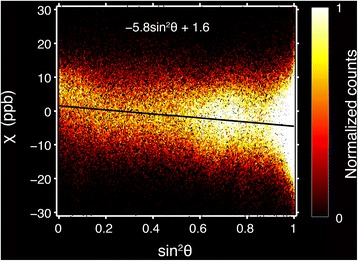
Fig. 6.

Magnetic susceptibility anisotropy of myocardium. Two-dimensional histogram of the voxelwise (n = 532,754) mean magnetic susceptibility as a function of the squared sine of the myofiber angle for a typical specimen. The average apparent magnetic susceptibility was calculated from the multi-echo GRE data acquired in a single specimen orientation. Myofiber orientation was calculated from the principal eigenvector of the DTI data
